Labtrail
A UX testing platform that runs on your own servers and brings the whole team into one workspace.
- Type
- Side project, self-hosted tool for UX research
- Role
- Product, UX and UI, built with AI assistance (Claude Code)
- Timeframe
- October to November 2026, first commit on 7 Oct, current state from 8 Nov
- Platform
- Web app for the research team, participant app for desktop and phone
- Tech
- Next.js, React, TypeScript, PostgreSQL with row-level security, Docker
Summary
For unmoderated usability tests I worked with a commercial tool and hit limits in three places: the cost was too high for the number of tests, the participants’ data sat with a third-party provider, and collaboration in the team didn’t work the way I had imagined. Every additional seat cost extra, studies were tied to the person who created them, and results were awkward to pass on.
So I built my own platform that I can adapt and extend to the way I work. Studies are made of building blocks: a task in a Figma prototype, a first-click test, a five-second test or a questionnaire. The design question behind it was: How does a testing tool become honest enough that you can trust its numbers without watching every session?
The problem
A testing tool delivers numbers on which a team bases design decisions. That makes three demands:
- Cost: Anyone who tests regularly needs a tool that doesn’t get more expensive with every study or participant.
- Control over the data: Participants’ clicks, answers and times are personal data in the broader sense. I wanted to know where they are stored and when they are deleted.
- Collaboration: Several people build studies, others only look at the results. Roles, shared images and shared results belong in the core, not in a more expensive plan.
In day-to-day work, collaboration broke down in three places:
- Paid seats: Every additional person in the team cost extra. So only a few had access, and everyone else got screenshots of the results instead of the results themselves. Questions like “Where exactly did people click on this screen?” came back to me.
- Studies tied to one person: Whoever created a study owned it. If that person was away, the others struggled to get to the study and its results.
- Passing on results was manual work: Sharing only worked inside the tool itself, and the export was limited. For presentations and my own analyses I copied numbers over by hand.
On top of that came the wish to adapt the tool to my own way of working: my own test flows, my own analyses, new methods later on. With a rented tool, you only get what the vendor provides.
The idea that shaped the design
With testing tools, the most convenient number is often the friendliest one. A hit rate looks better if you leave out the people who chose “I don’t know”. A success rate looks better if the participant’s browser reports by itself that the goal was reached.
That turned into the guiding principle: Every number has to be calculated so that, when in doubt, it counts against the design being tested, and it has to be traceable.
Key decisions
Decision 1
A study is a list of building blocks
Instead of fixed test types, every study consists of an ordered list of blocks: welcome, tasks, questions, thank-you screen. This lets you combine methods, for example a prototype task followed by a SUS questionnaire.
Technically, each block type has exactly one description, shared by the builder, the participant app and the results. A new test method therefore needs no change to the database. That matters, because card sorting and tree testing are next.
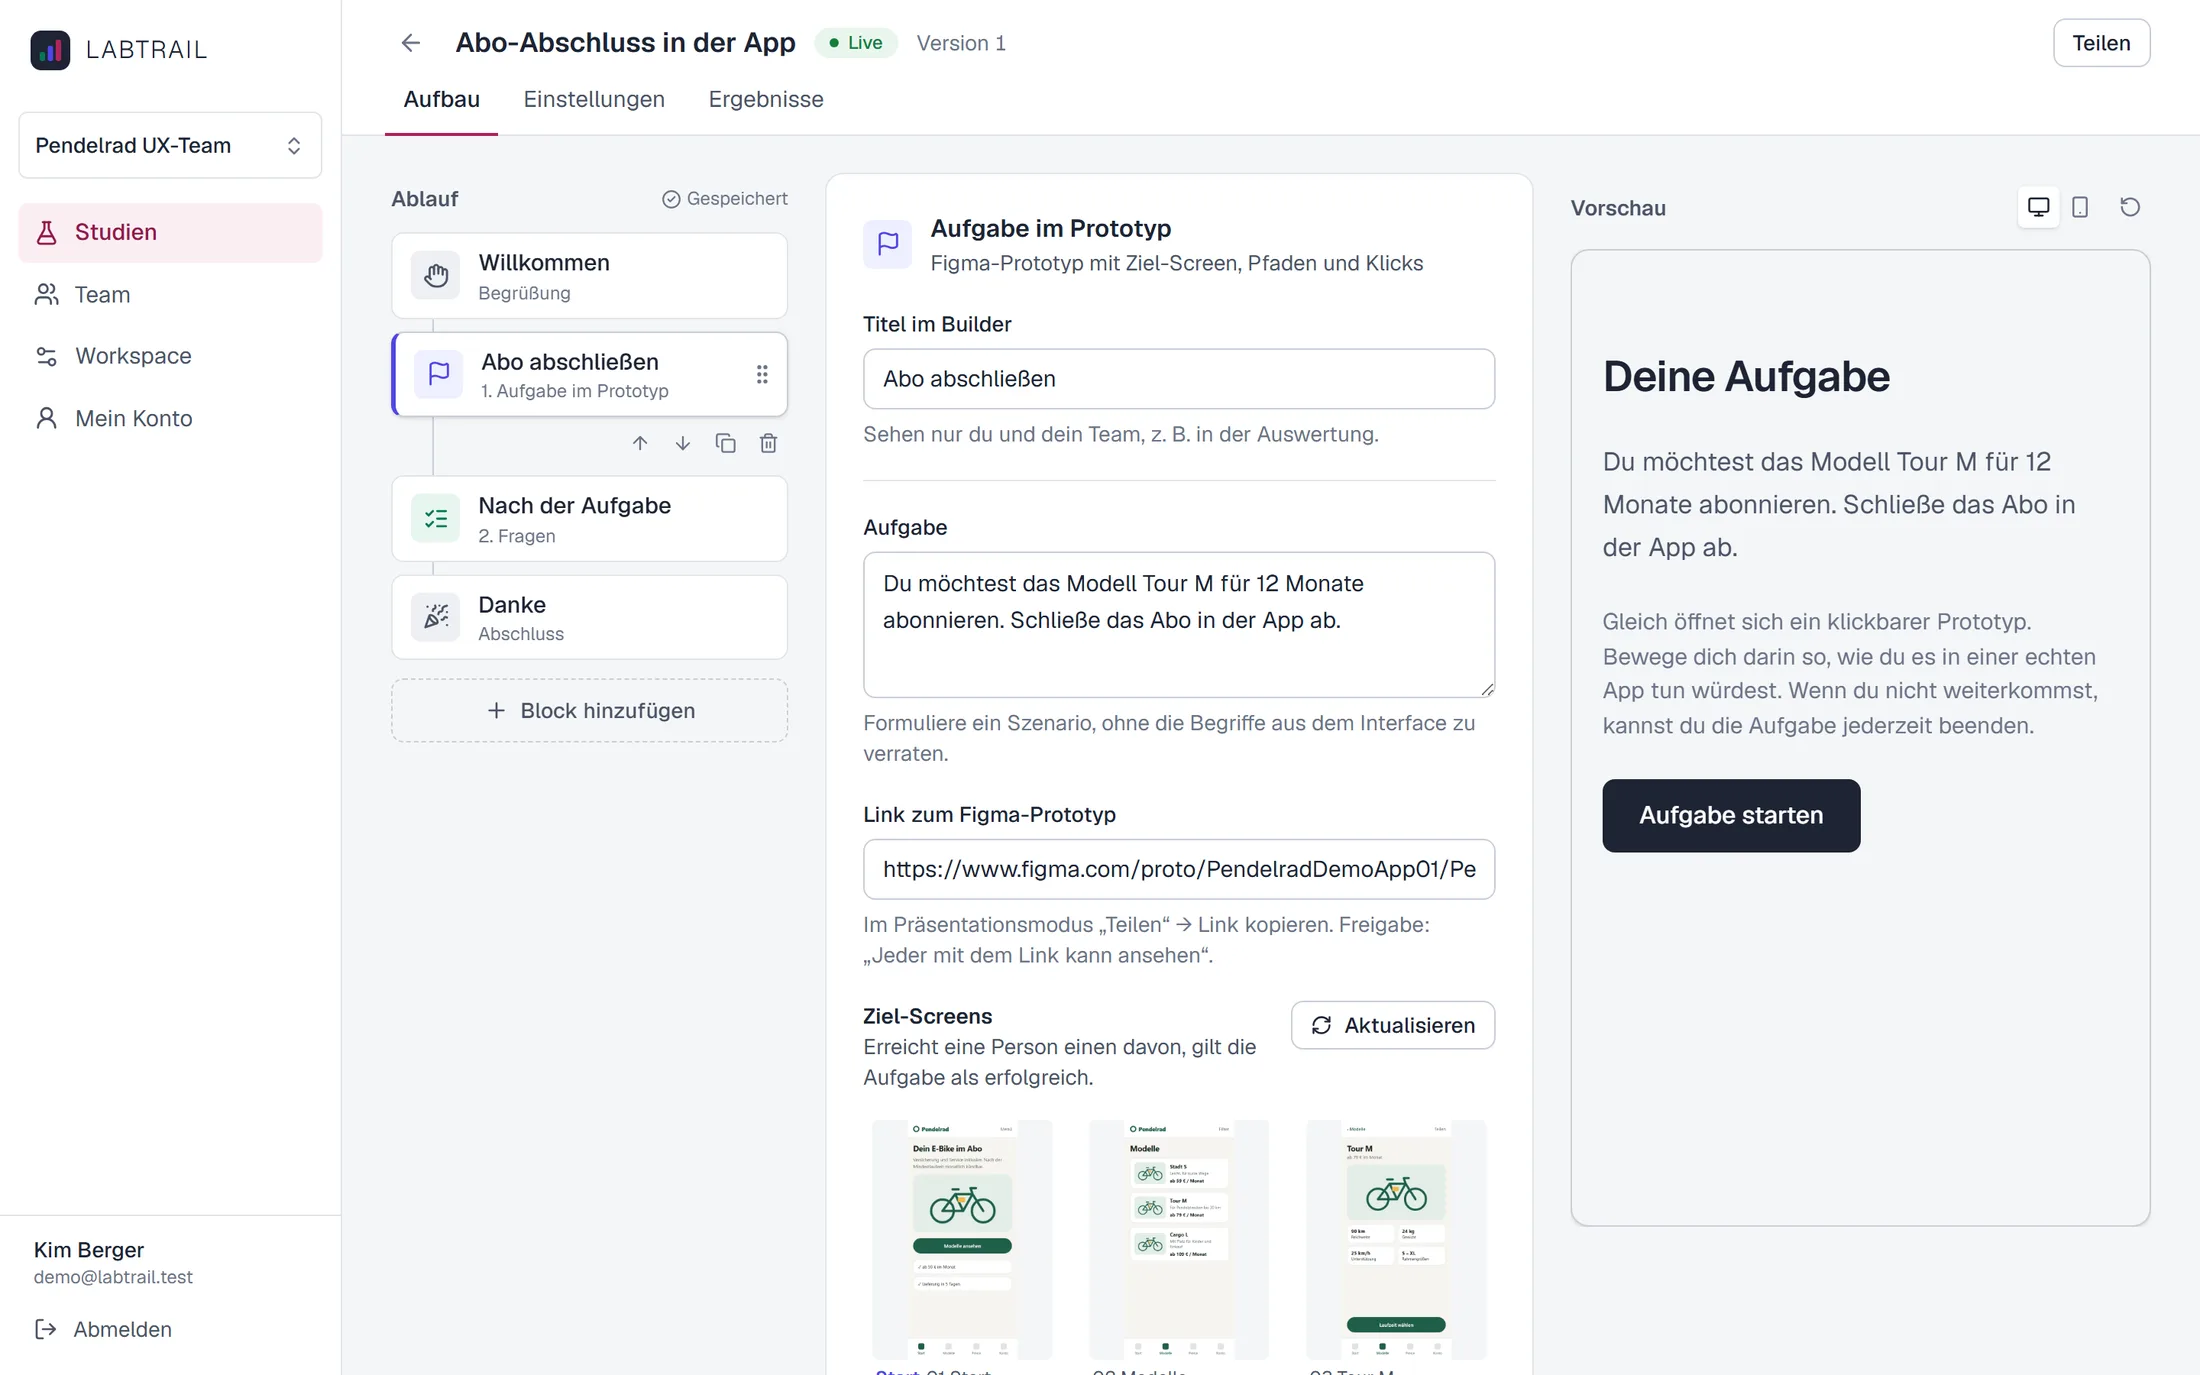
Drafts may be incomplete. Only on publishing does the app check everything and freeze the study as a version. Results always belong to exactly one version, so that a later change doesn’t quietly shift the meaning of old answers.
Decision 2
Real Figma prototypes instead of screenshot sequences
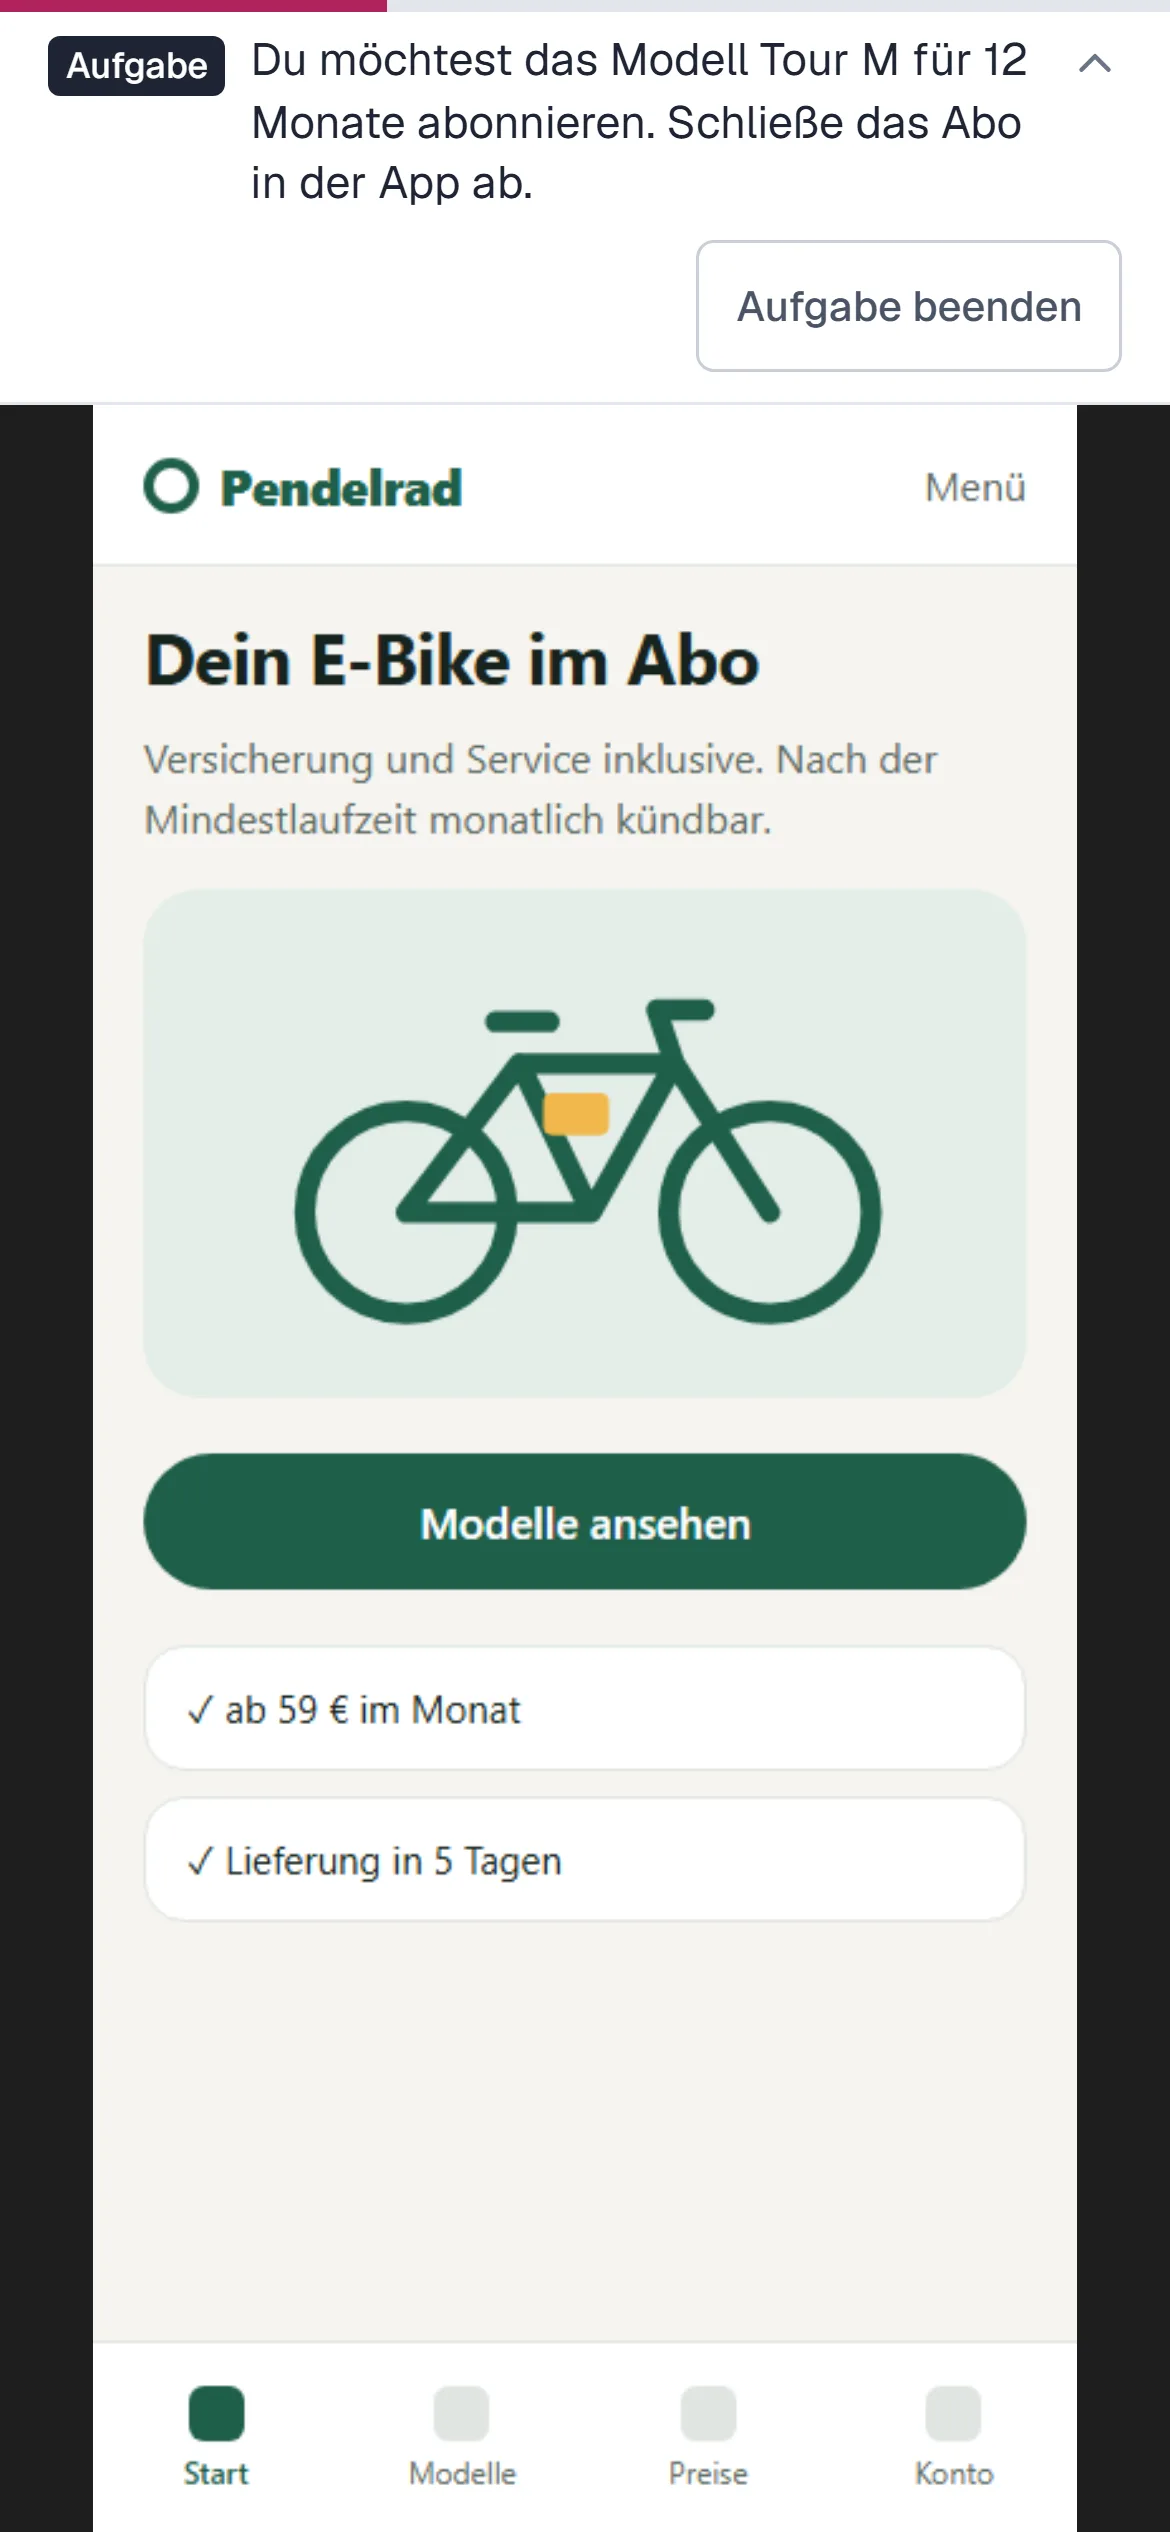
Many tools break prototypes down into single images with click areas. Animations, overlays and states get lost, and participants experience something other than the design. Labtrail therefore embeds the Figma prototype directly. Before building, I checked in a small spike that this also works for participants without a Figma account.
The price: the interface reports screen changes and clicks, but no mouse movement. And click positions come relative to the clicked element, not to the screen. The app therefore stores the raw data and only converts it to the screen during analysis, using the layer positions from Figma. If the conversion improves later, that applies to old studies too.
Decision 3
The server decides whether a task is solved
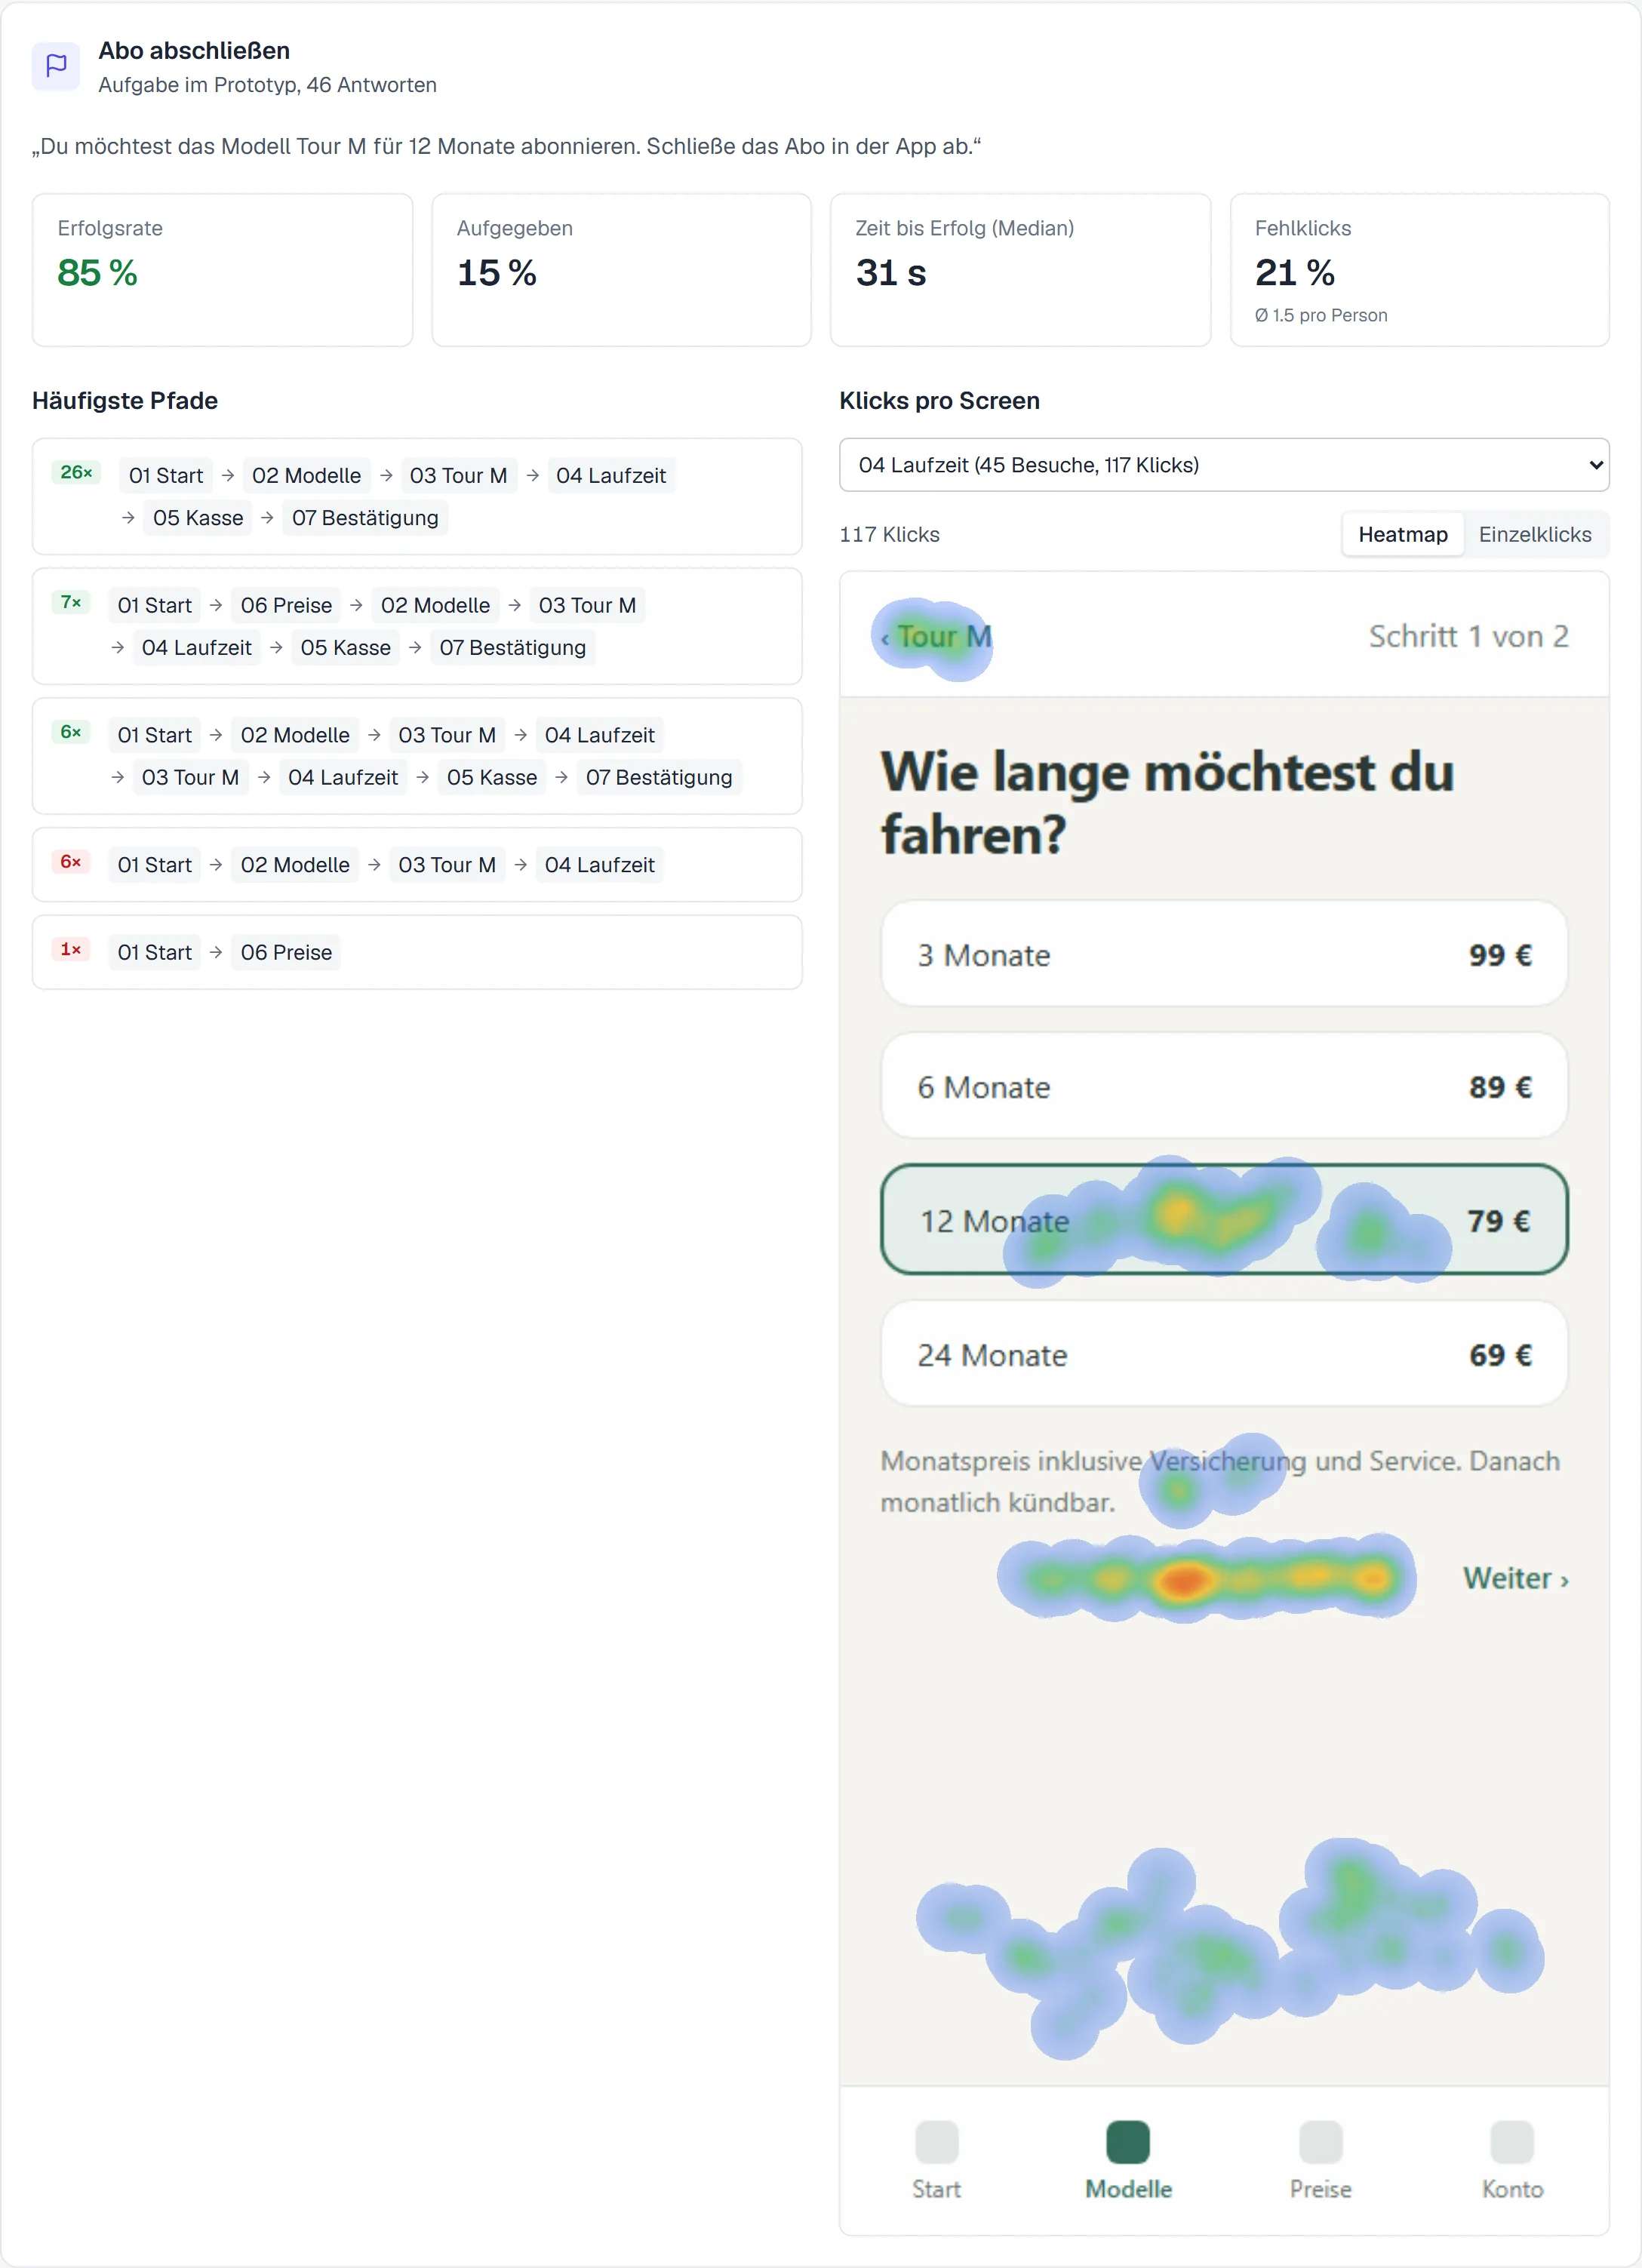
The participant app runs in strangers’ browsers and therefore can’t be trusted. It only reports what happened: which screens, which clicks, how long. Whether the goal was reached or a click landed in a target area is calculated by the server from the published version of the study.
That protects not only against manipulation but also against my own mistakes: if the participant app changes, the scoring stays the same.
Decision 4
“I don’t know” counts as not found
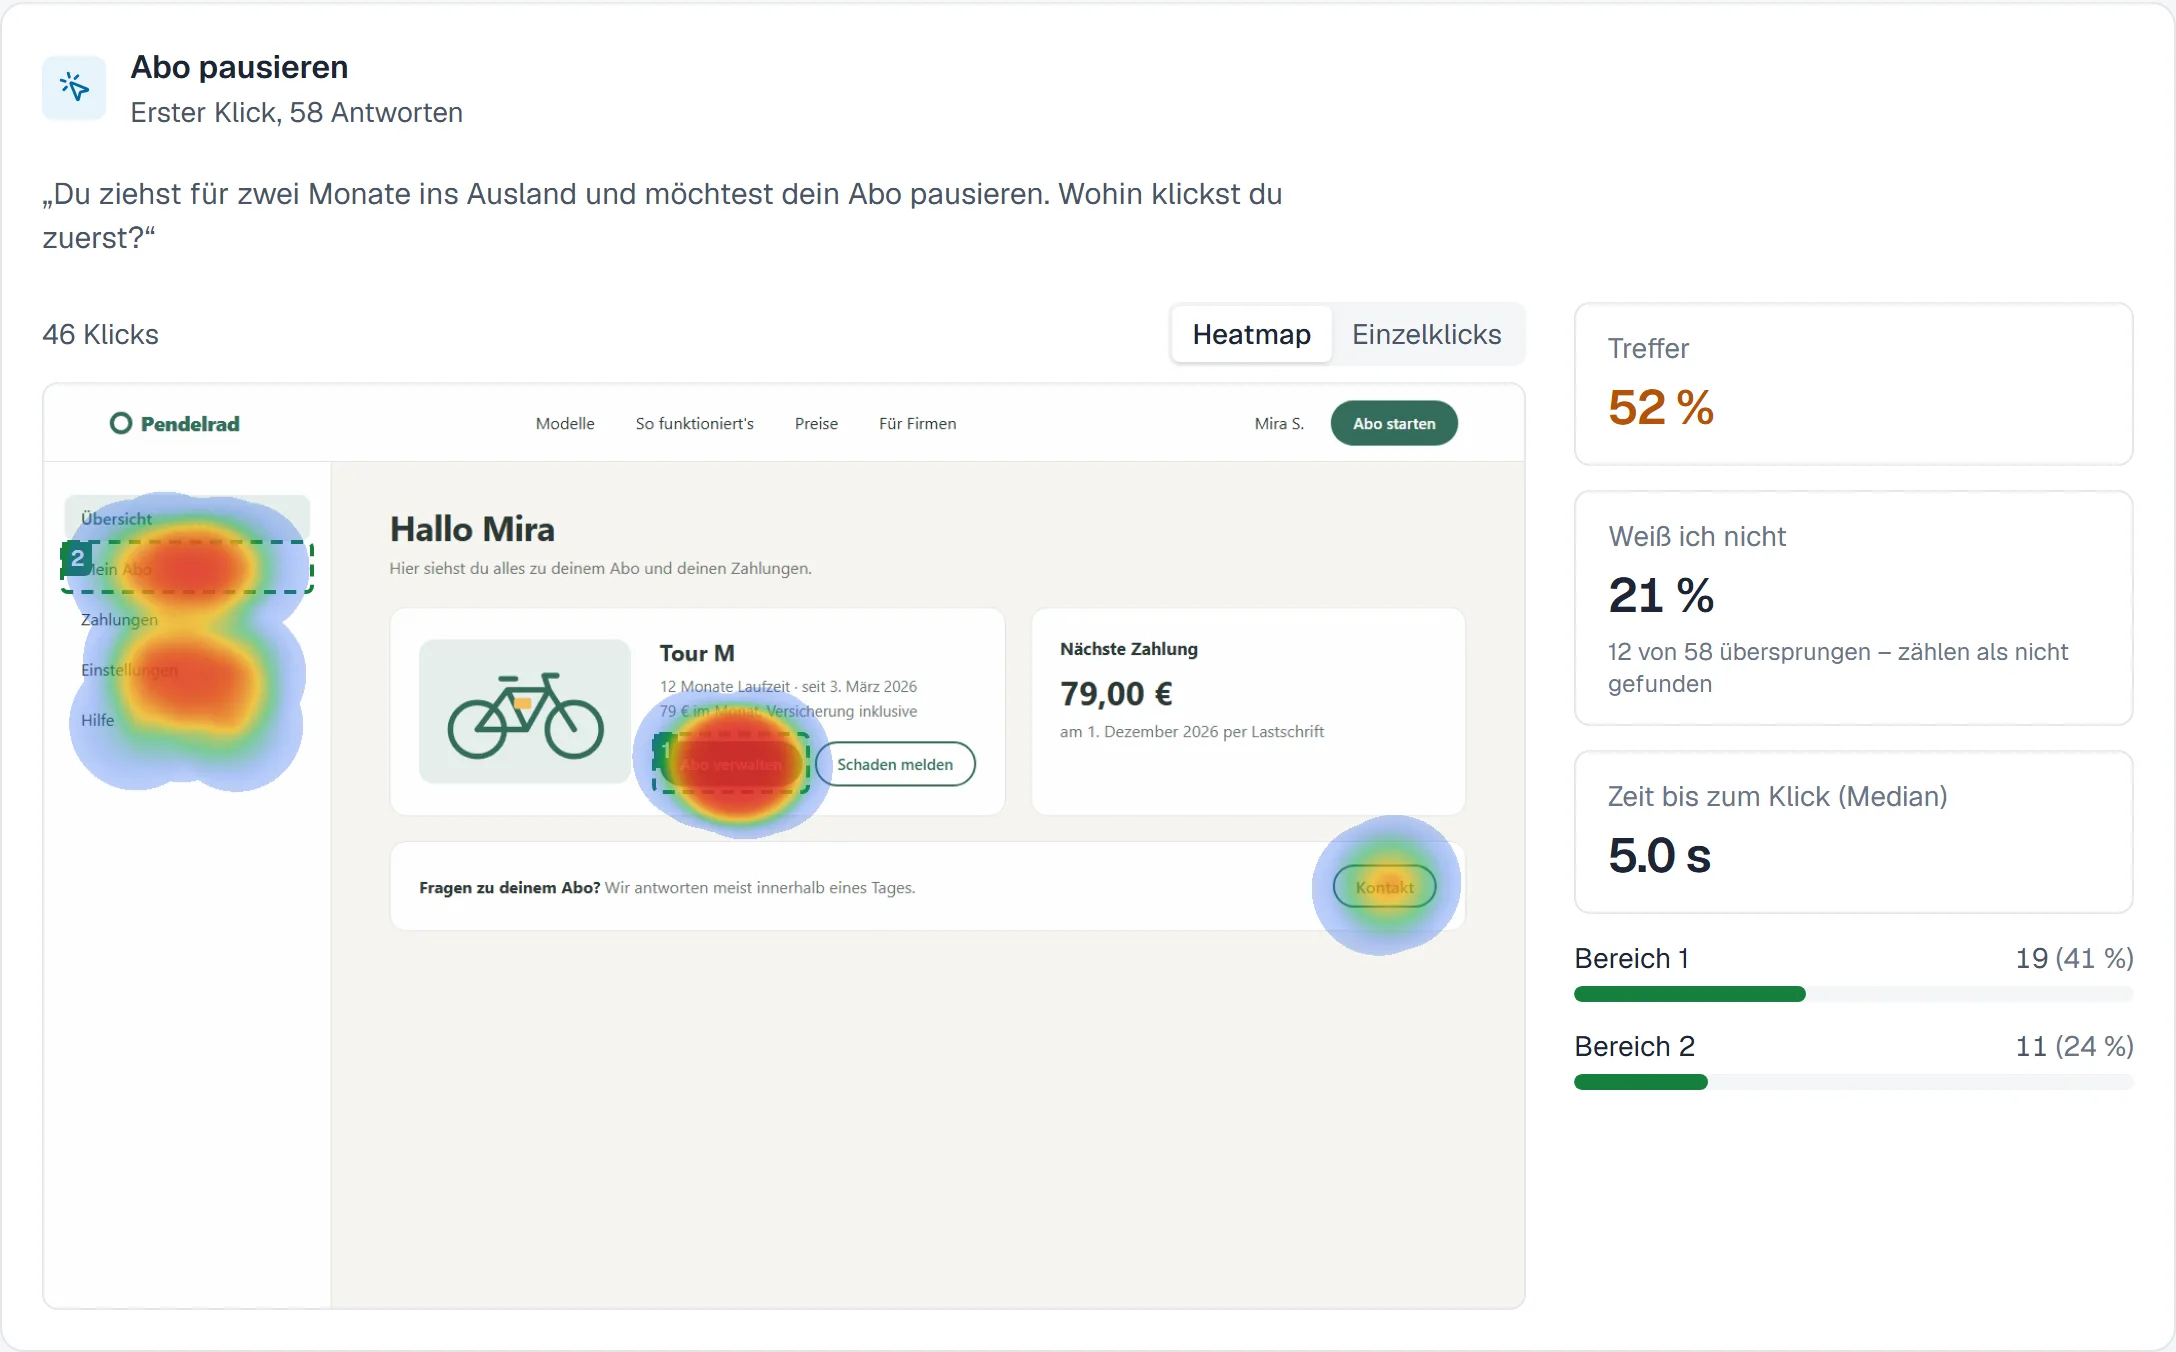
In a first-click test, participants can choose “I don’t know”. That prevents guessed clicks that distort the result. In the hit rate, though, these answers count as not found and are also shown separately. Leaving them out would raise the rate in the example from 52% to 65%, exactly the friendly number the guiding principle is meant to prevent.
Decision 5
Privacy as part of the flow
Privacy isn’t a setting here, it is built into the flow:
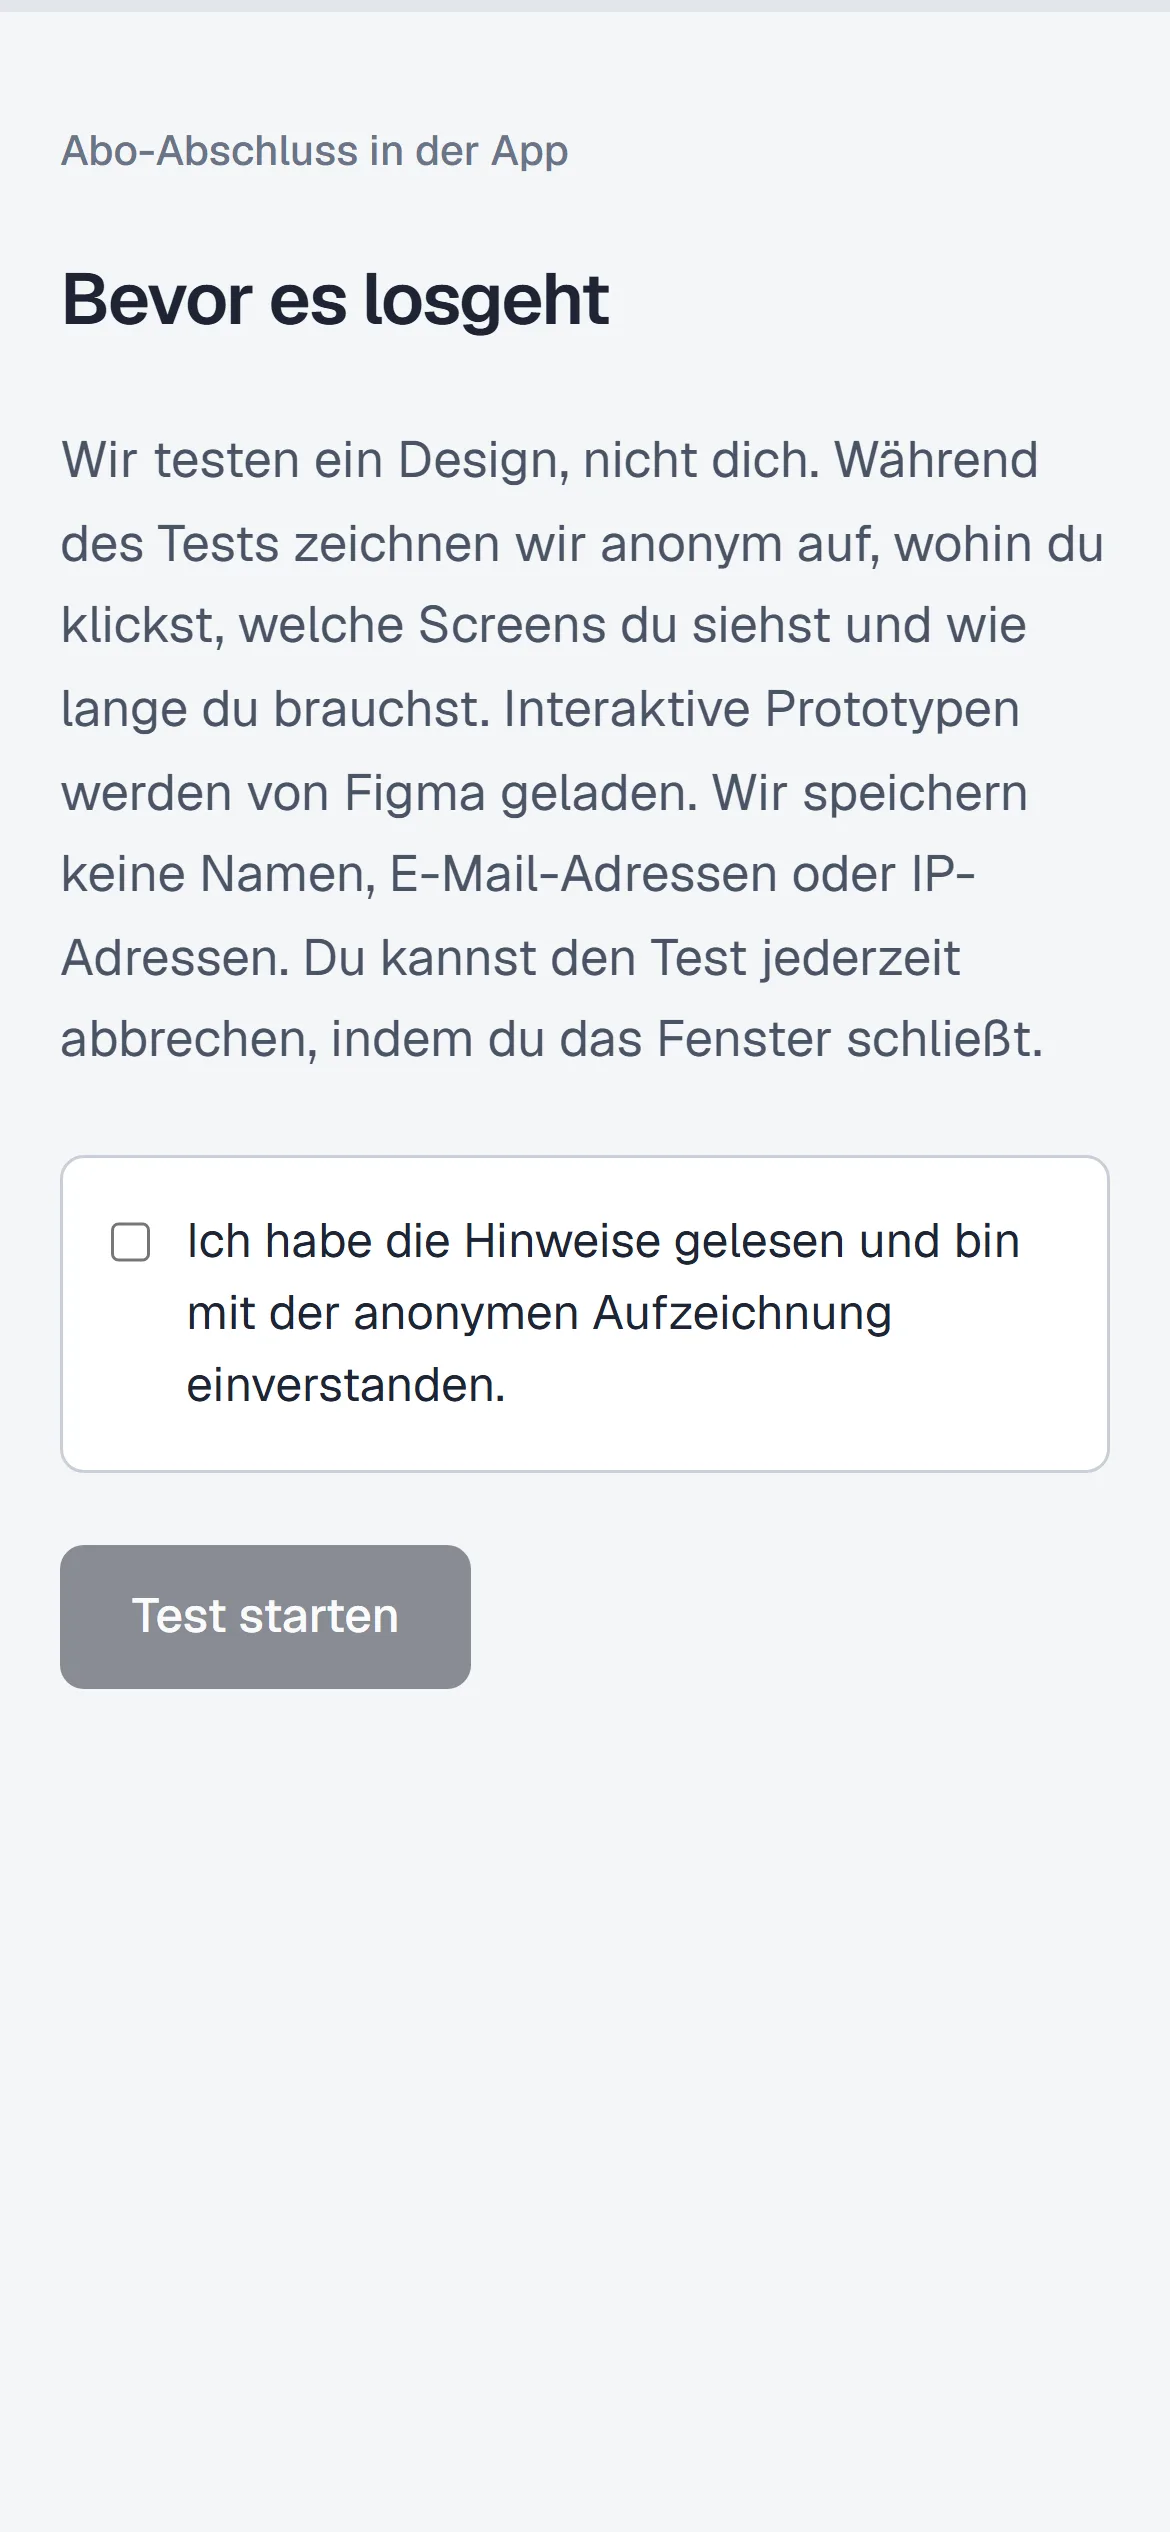
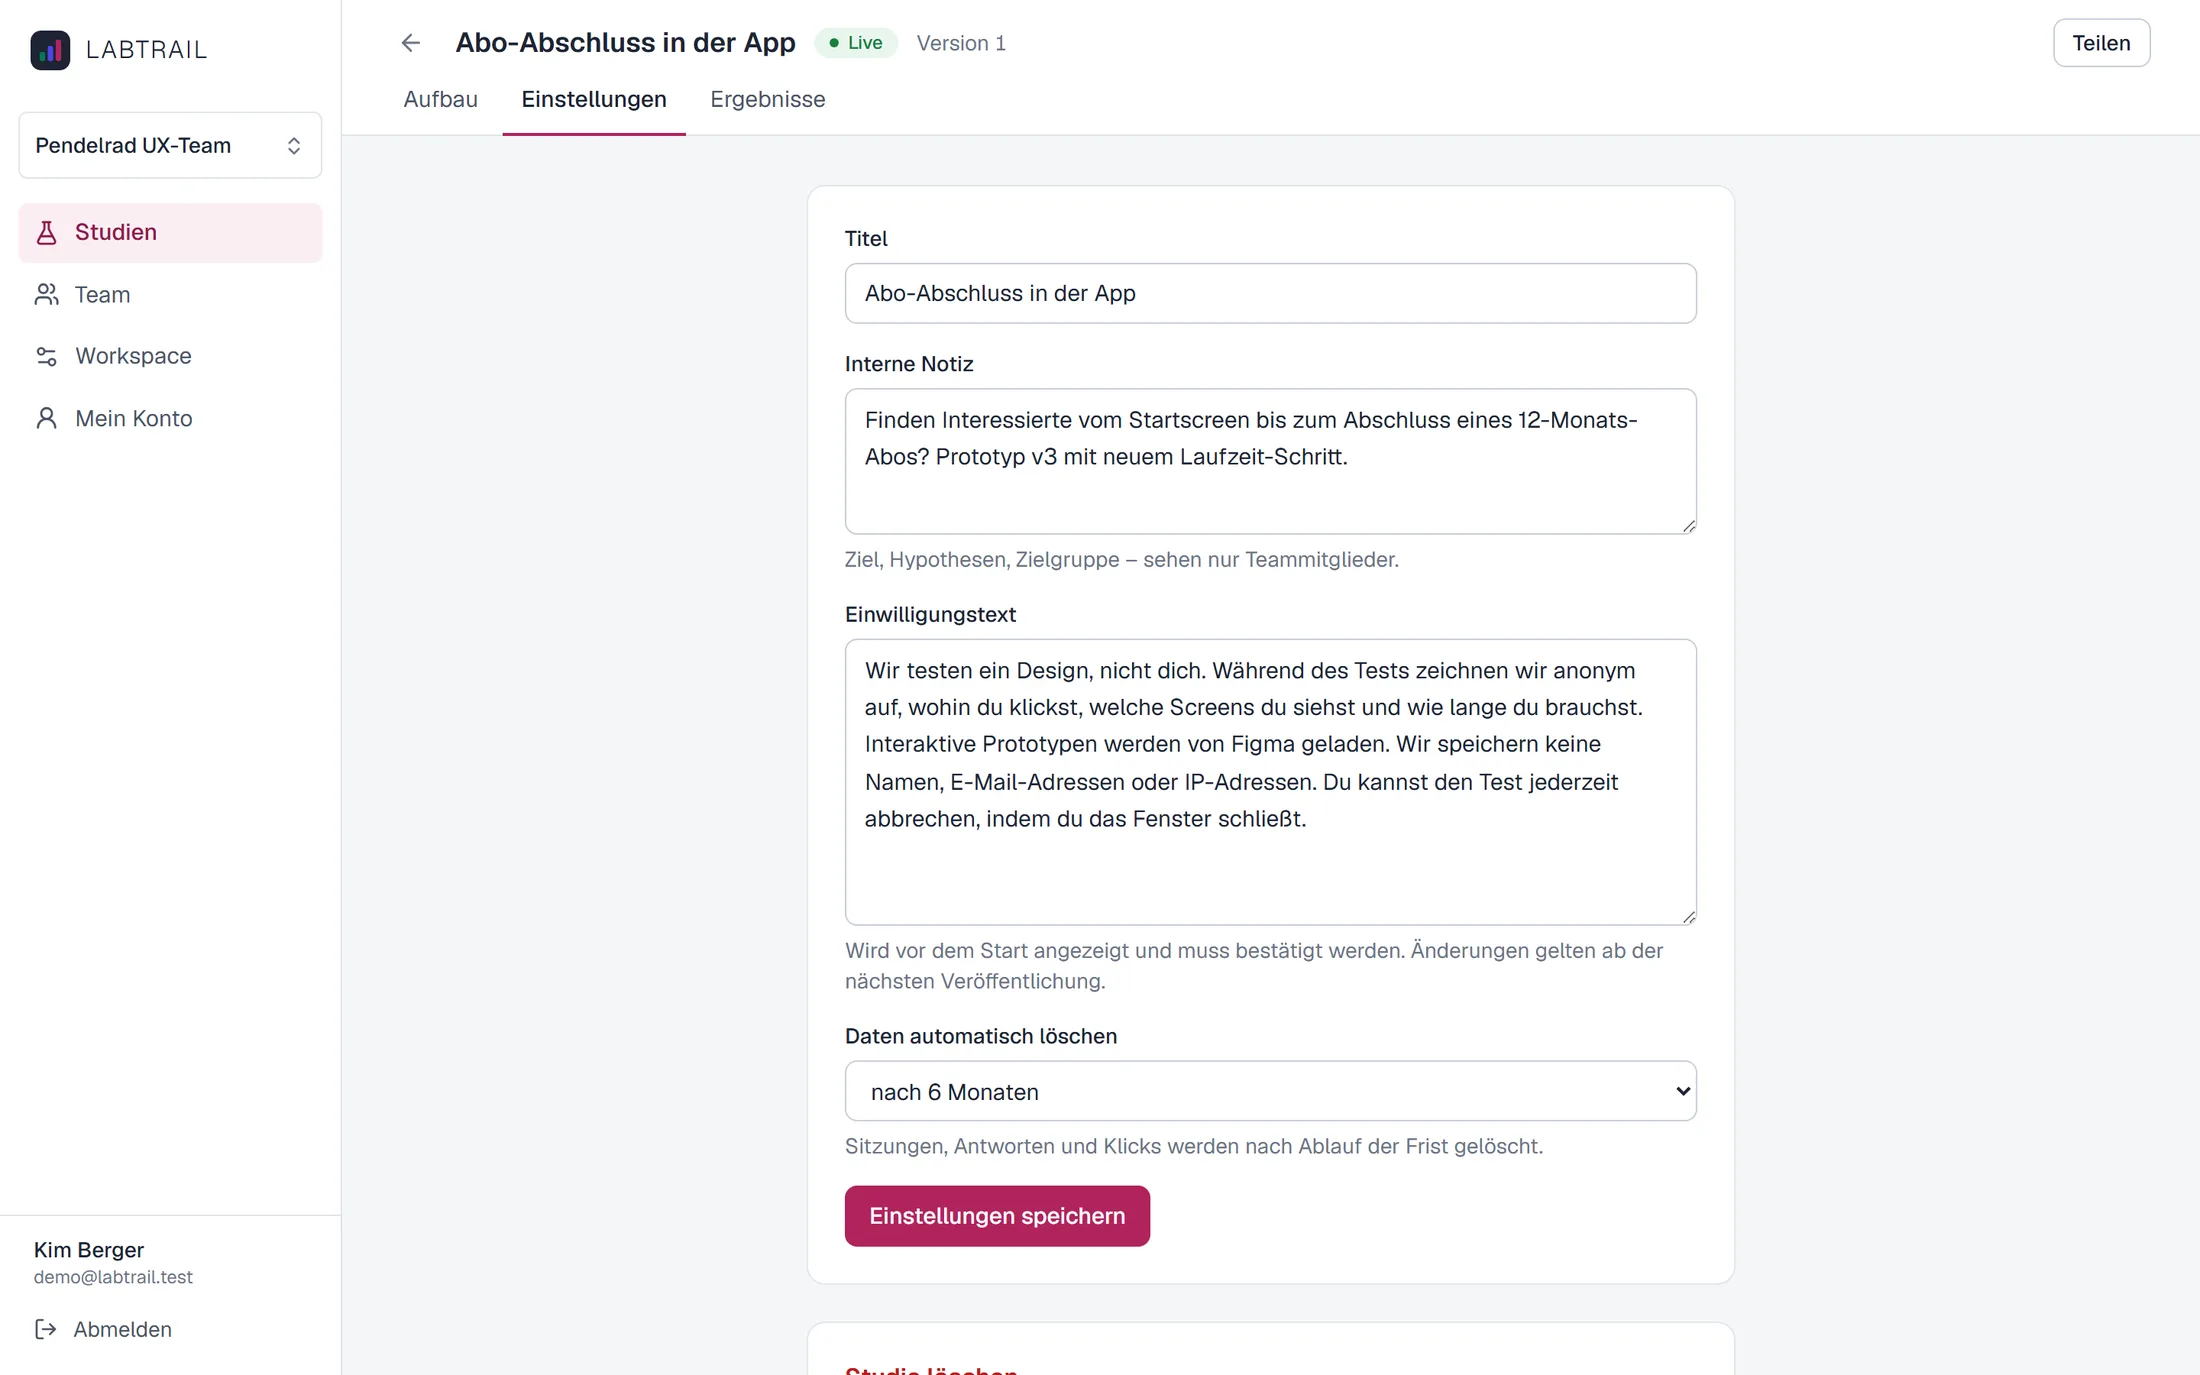
- Consent before the start: No checkbox, no test. The text can be adapted per study and is frozen with the version.
- Pseudonymous sessions: No names, no email addresses, no IP addresses. The only external connection is the embedded Figma prototype, and the consent says so.
- Retention periods per study: Sessions, answers and clicks are deleted automatically when the period ends.
Decision 6
Collaboration in workspaces, cleanly separated
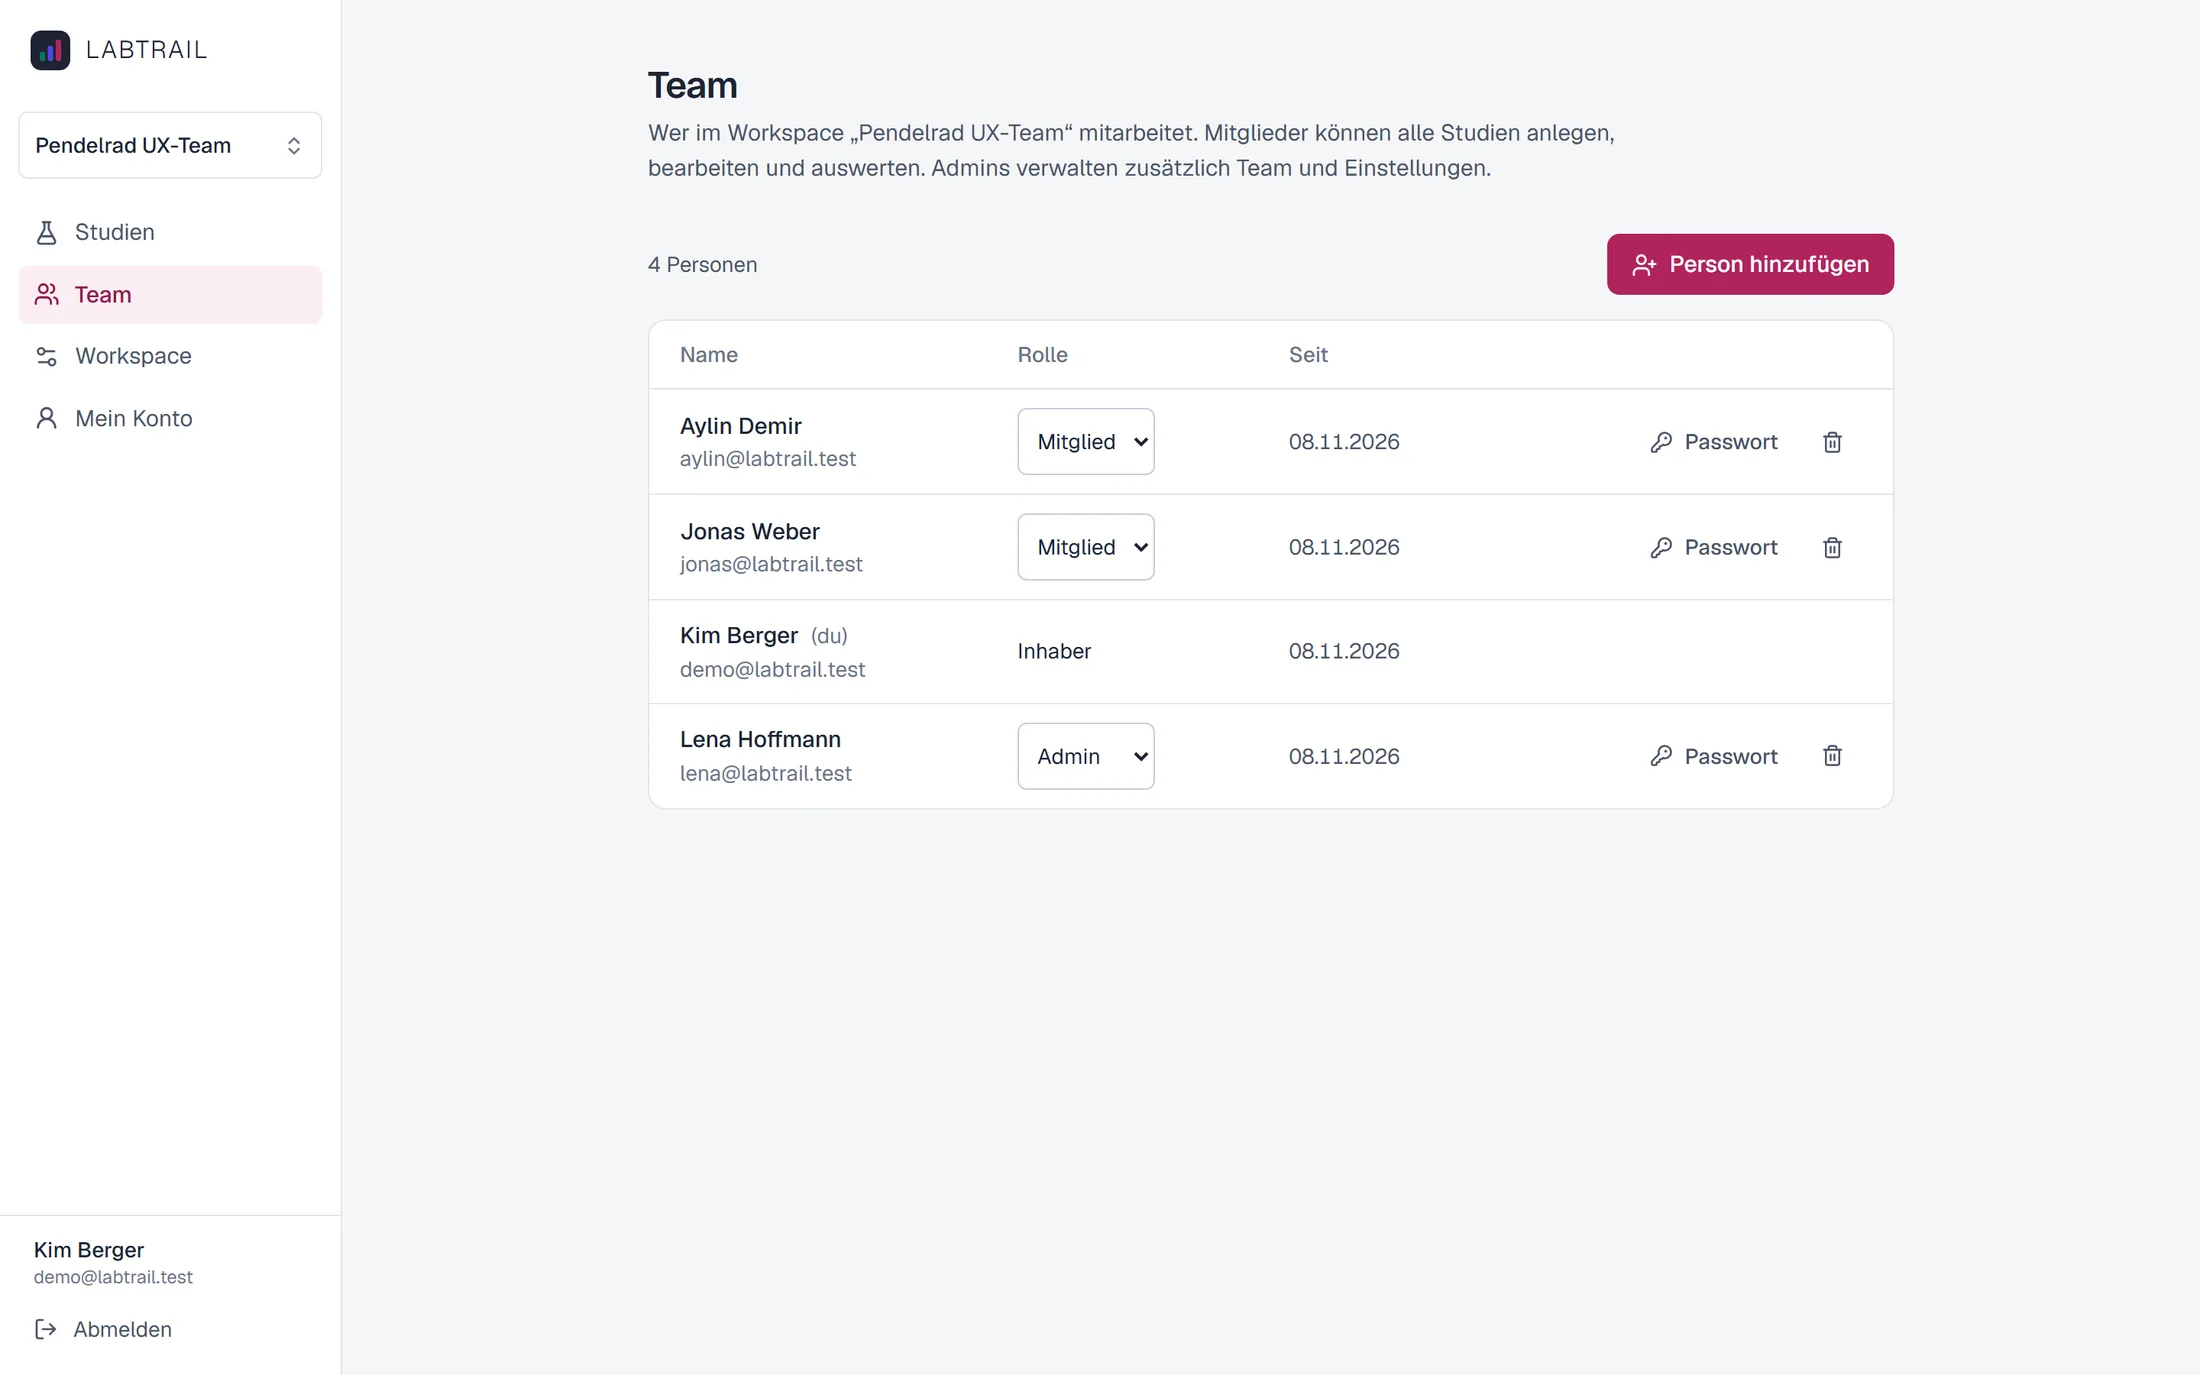
A team works in a workspace with the roles owner, admin and member. The answers to the three problems above:
- No seat licences: A workspace has as many members as needed. Anyone who only wants to look at results gets their own access instead of a screenshot.
- Studies belong to the team: Every study lives in the workspace, not with the person who created it. All members can edit and analyse it. Only owners and admins manage the team and the settings.
- Results as raw data: Every version of a study can be exported as CSV or as JSON with all sessions, answers and clicks, for a spreadsheet, a presentation or your own analysis.
Several teams, products or clients each get their own workspace. To make that safe, the database itself separates the workspaces: every query runs with a restricted database role, and Postgres only returns rows of the active workspace, even if a query forgets the filter. A test fails as soon as a new table is created without this rule.
Decision 7
The participant app is built for people who know nothing about UX
Participants see no jargon, only plain, friendly sentences. All controls can be reached by keyboard, touch targets are at least 44 px, and the task stays visible at the top during the test, collapsible.
While making the screenshots for this page, I noticed that on narrow phones the task text was squeezed into a narrow column, because the “end task” button next to it took too much space. Now the button moves to its own line when space runs out.
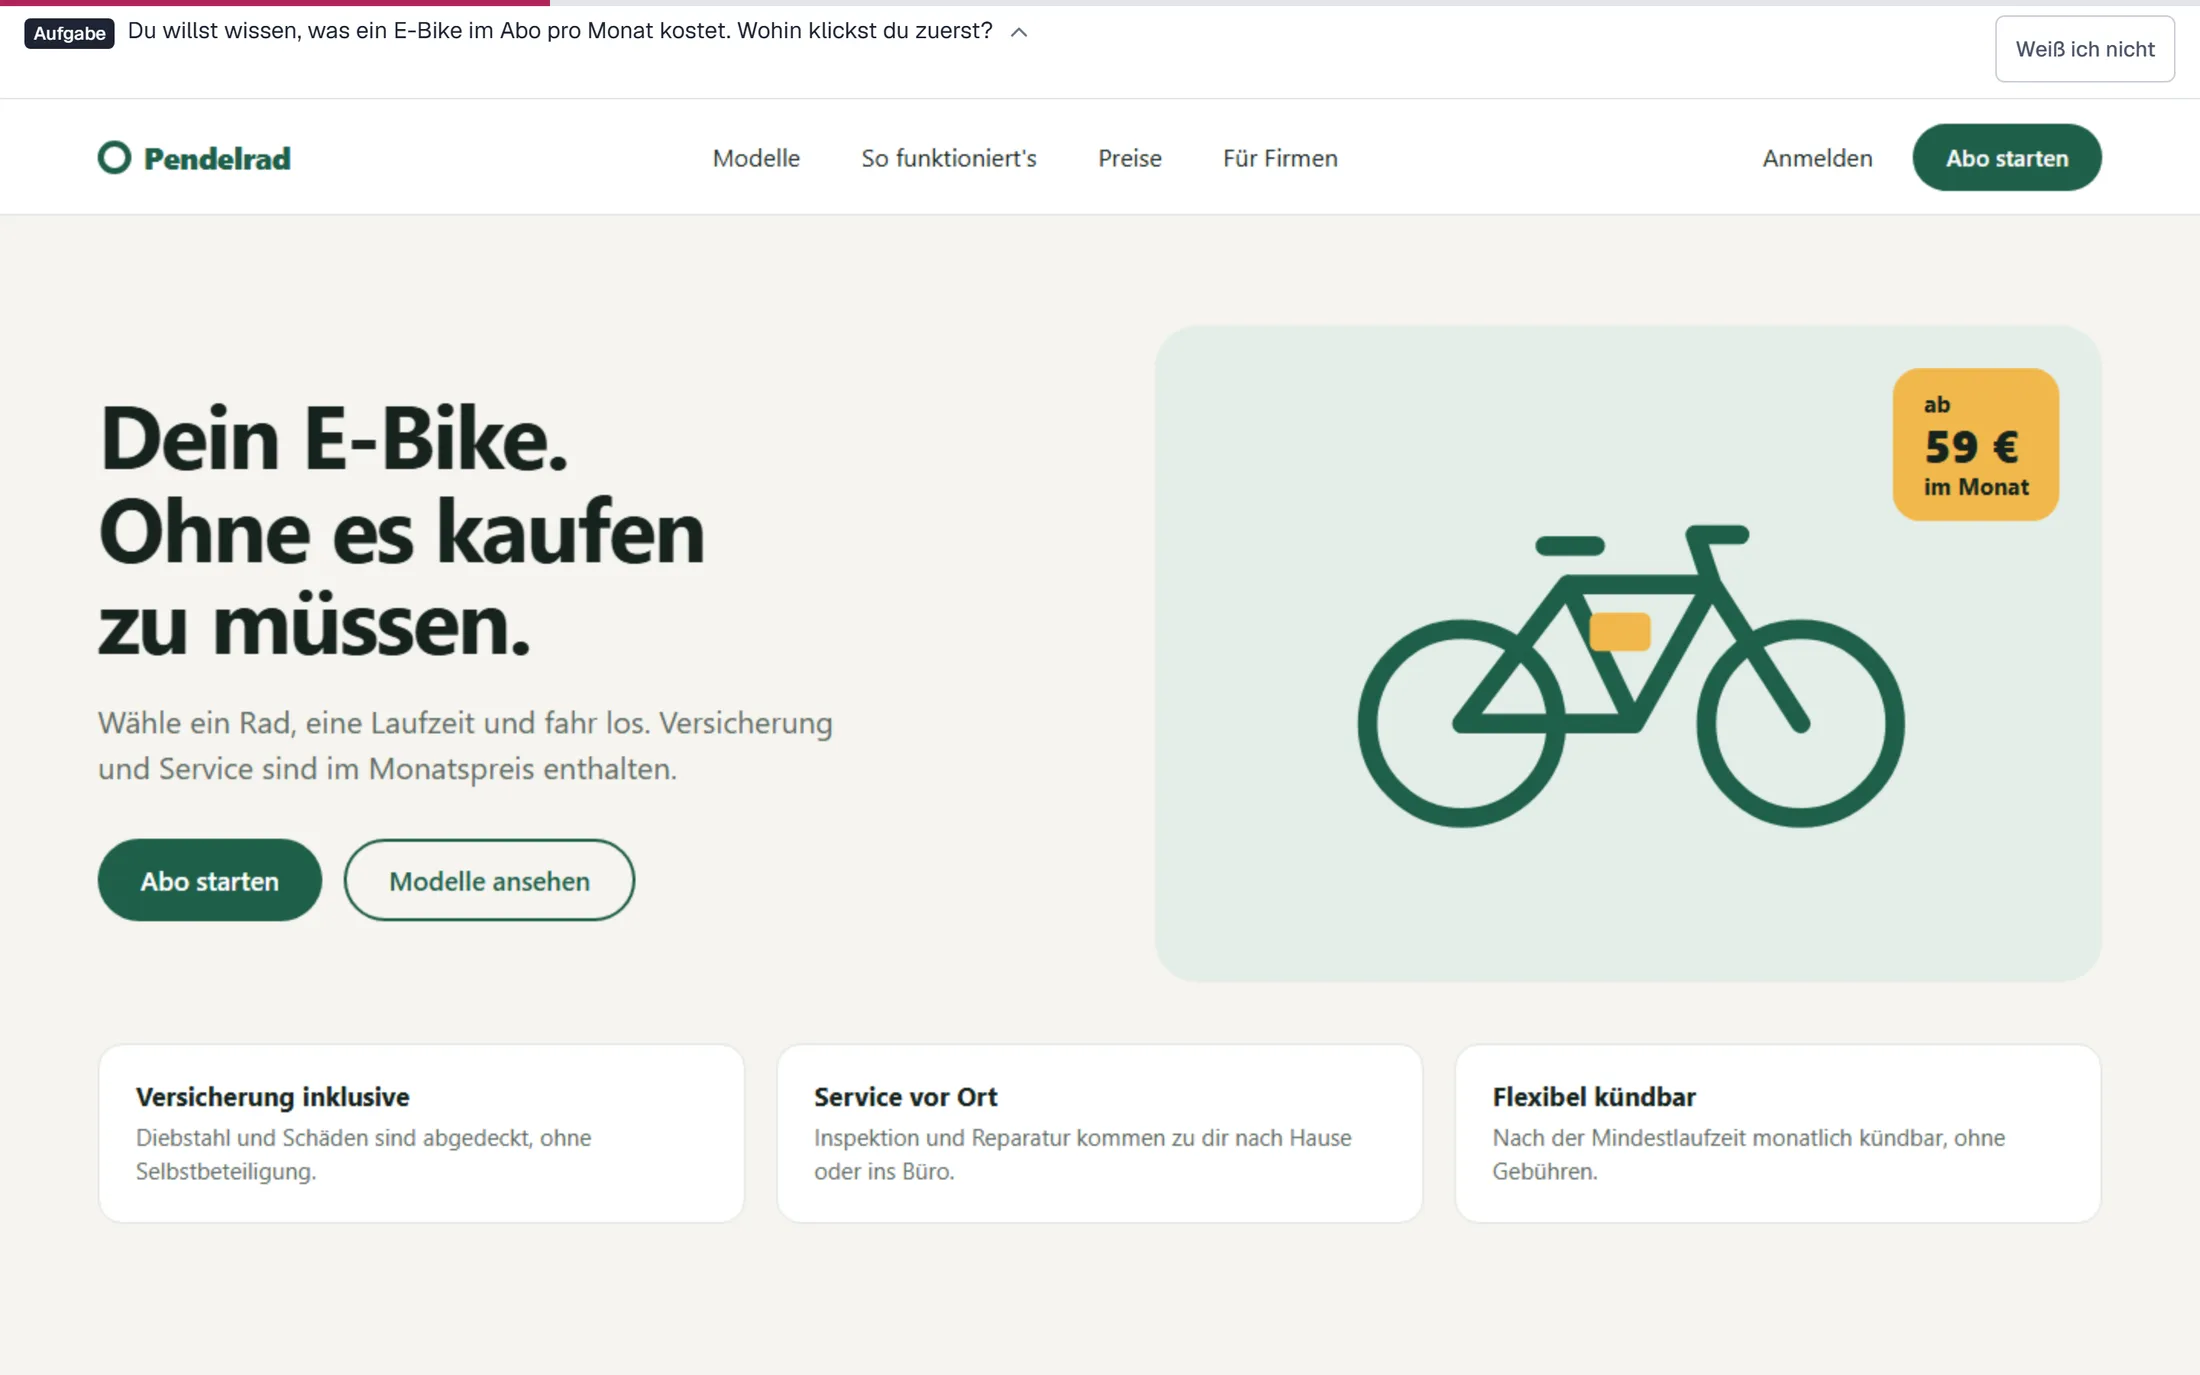
The demo: a made-up brand, simulated participants
There is no real study data I could show on this page. So I created a fictional brand, “Pendelrad”, an e-bike subscription, and three studies with simulated participants:
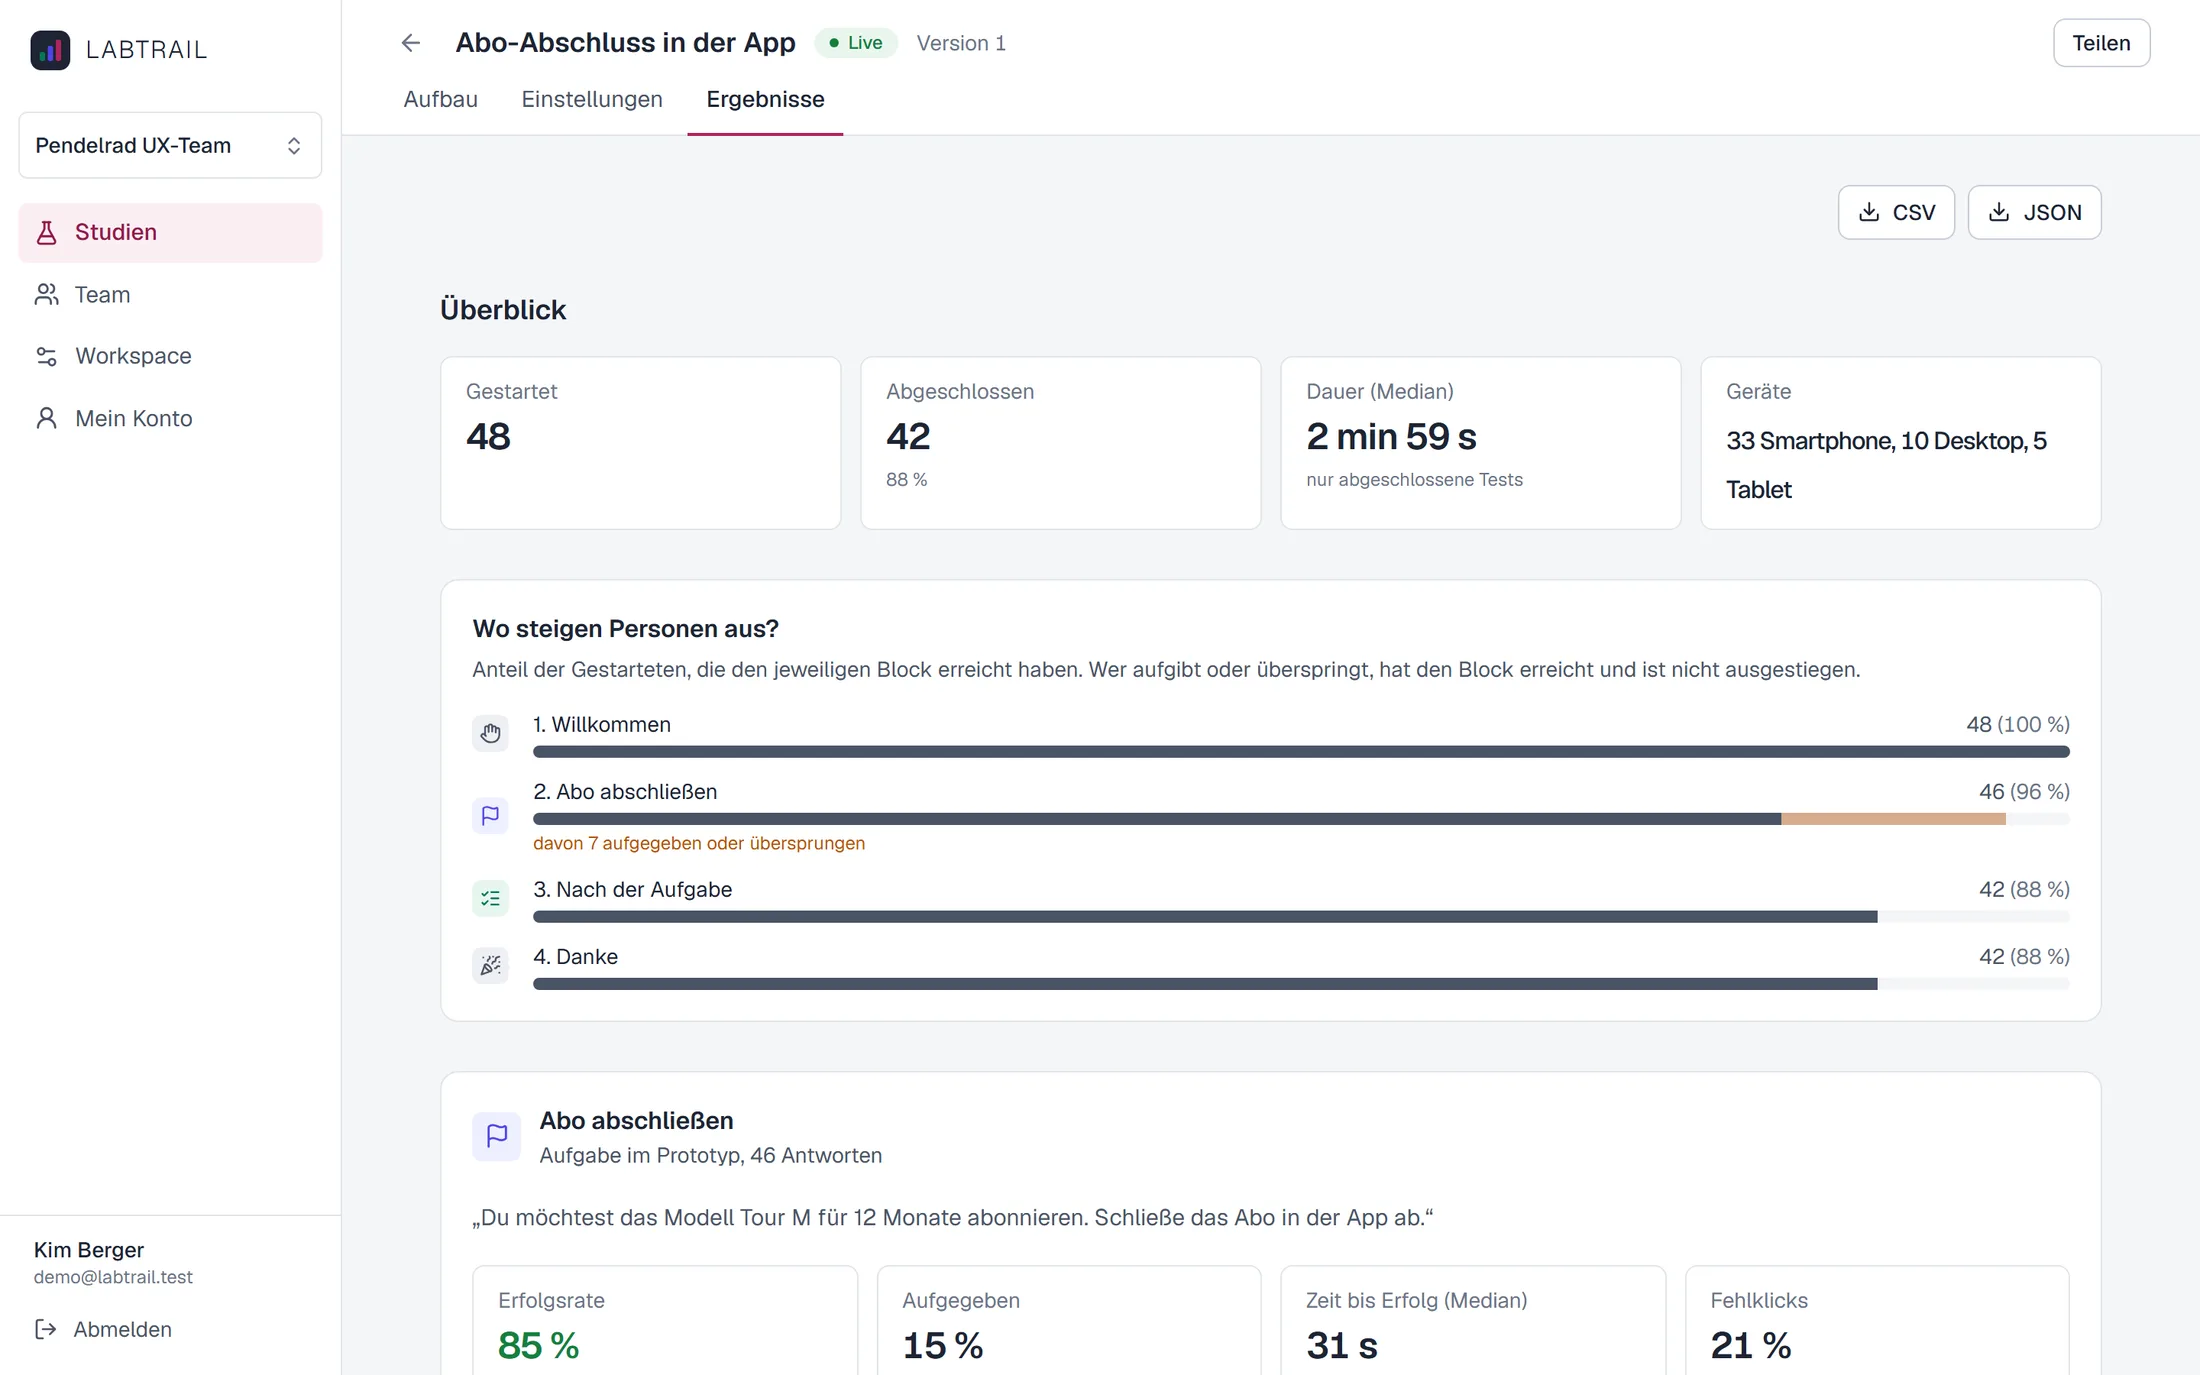
- Subscribing in the app: prototype test with 48 sessions, followed by questions and SUS.
- Home page and customer account: two first-click tests and NPS, 64 sessions.
- First impression of a campaign page: five-second test with 40 sessions.
The screens are my own design. The participants are simulated by a script that submits every session through the same paths as real participants. The data therefore goes through the same checks and analysis. The script contains a deliberate weakness: on the contract length screen, “Next” is only a small text link where many expect a button.
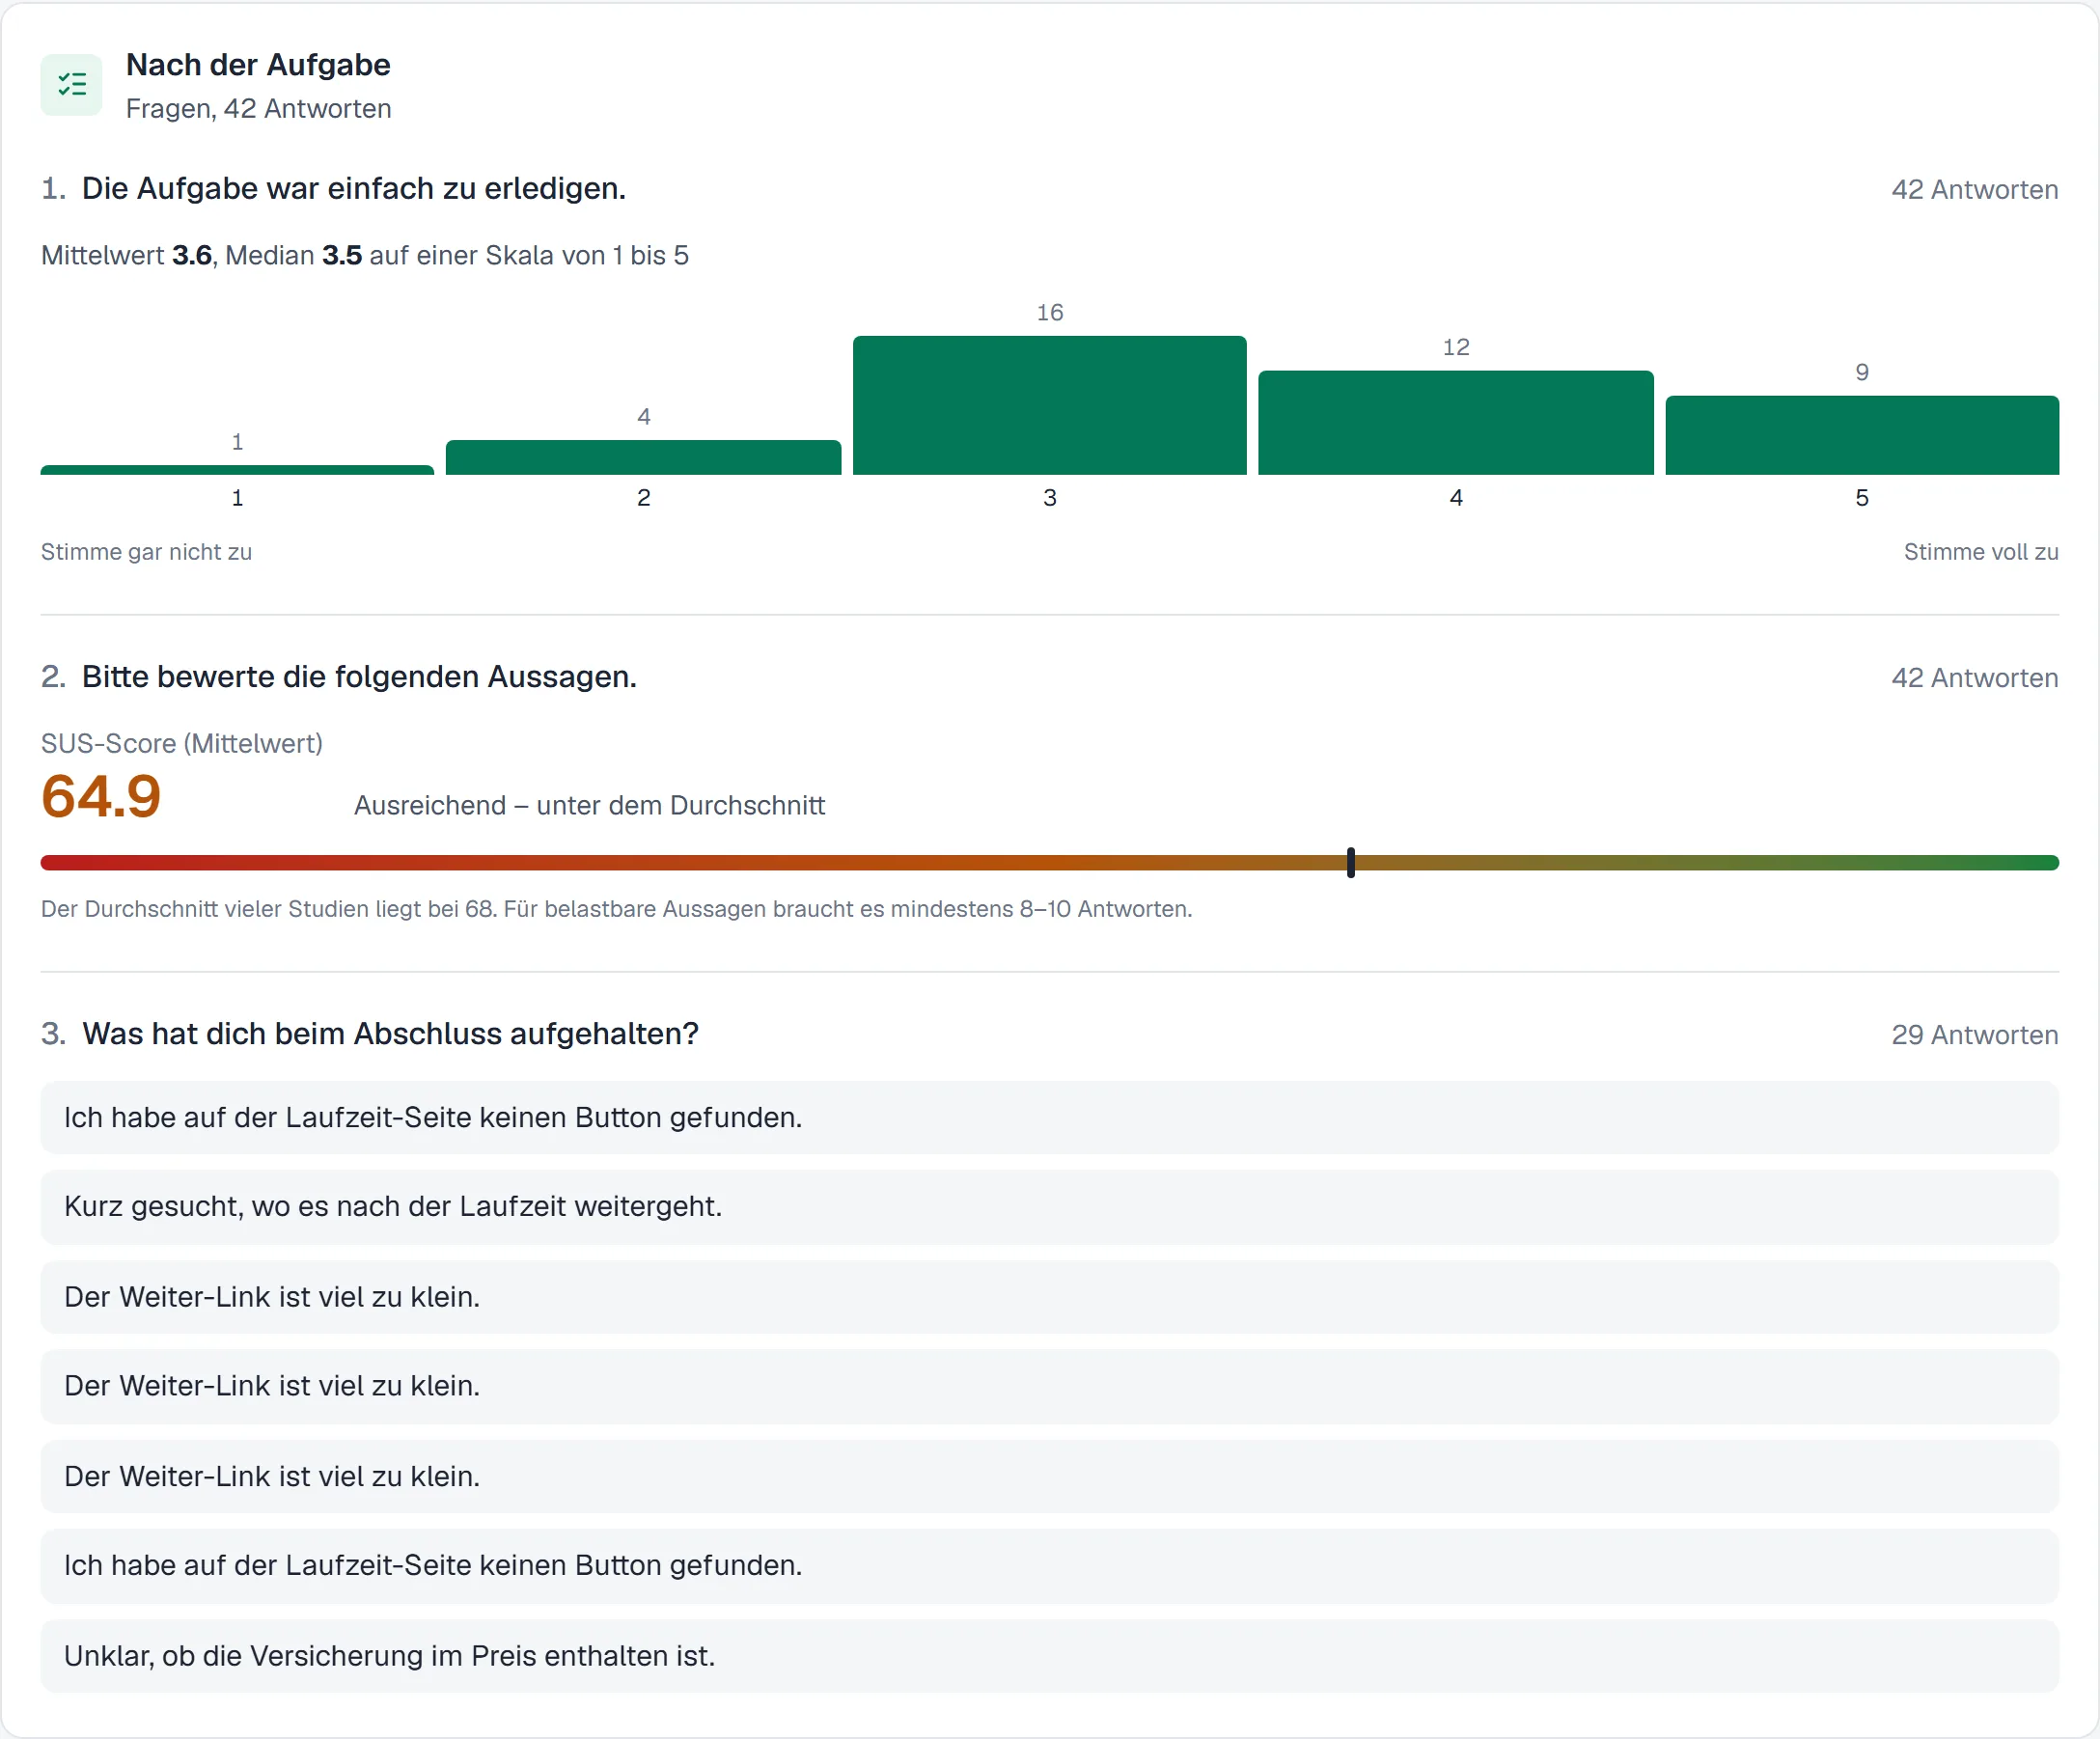
That is exactly what the results show, without having to look for it: 85% complete the subscription, but misclicks cluster at the bottom of the contract length screen, most drop-offs happen there, and the free-text answers mention the link. Together that adds up to a SUS of 64.9, just below average.
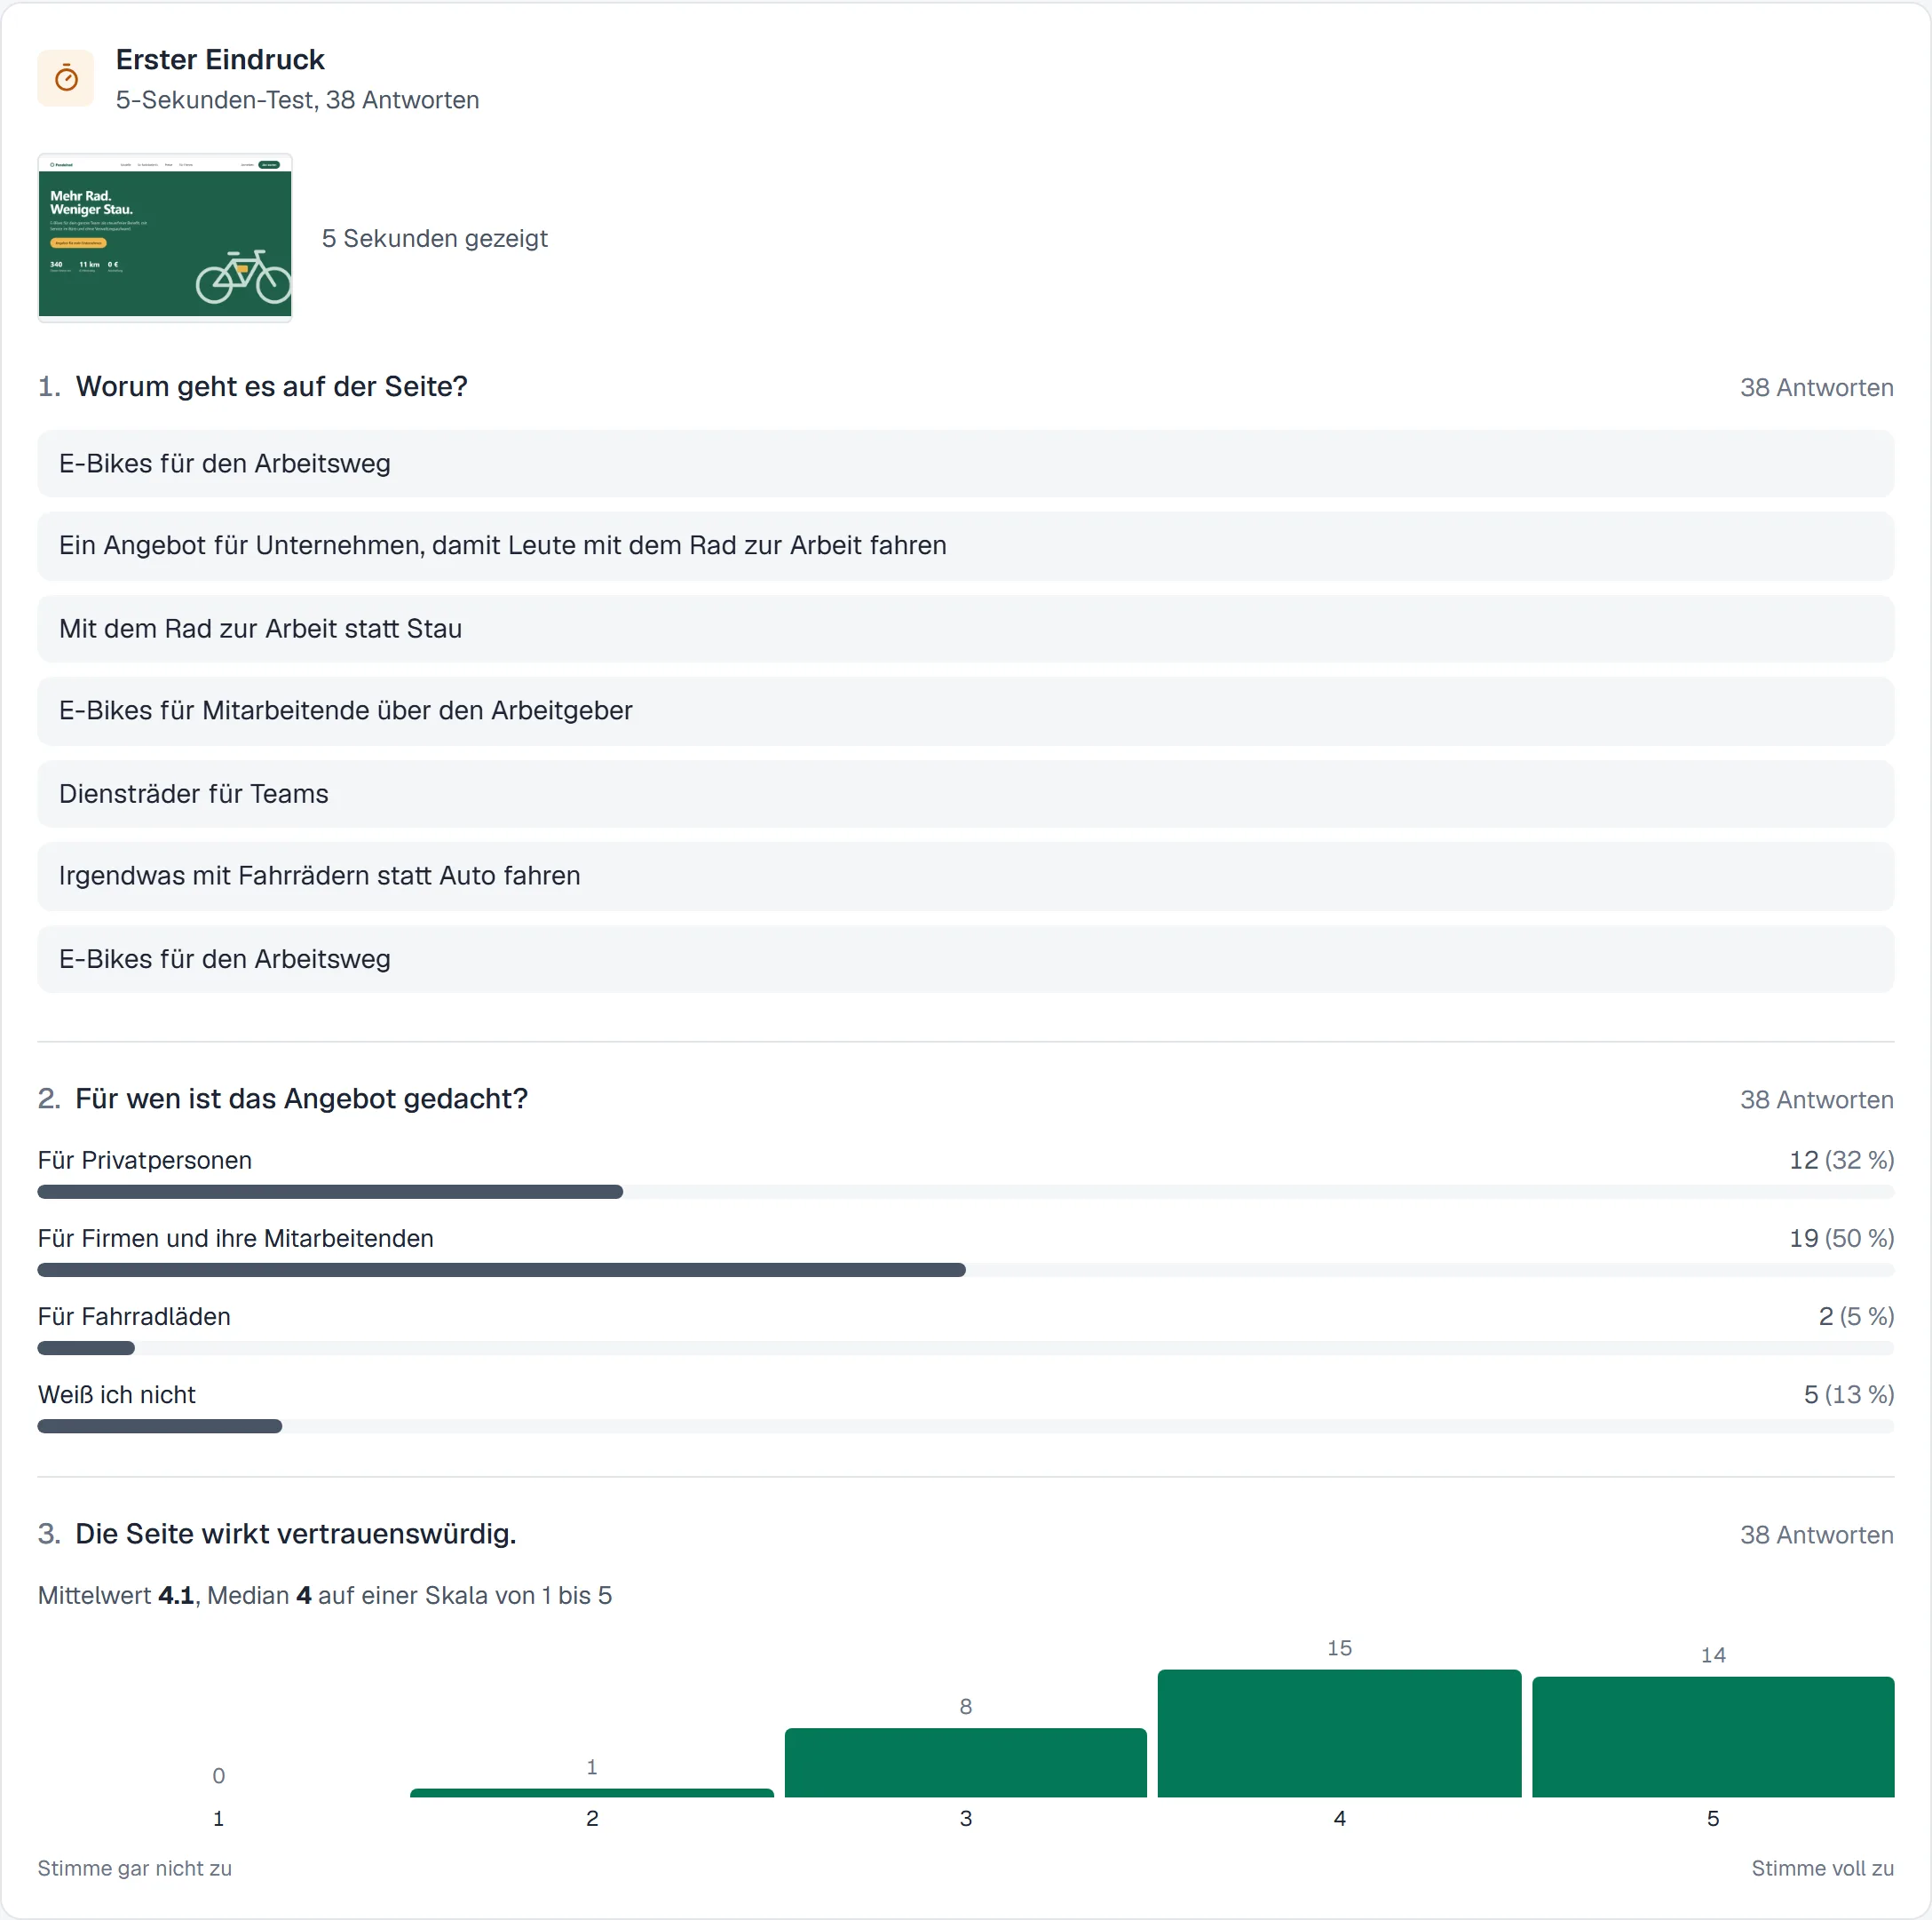
The five-second test tells a story too: the campaign page is aimed at employers, but only half recognise that within five seconds.
As of 8 November 2026
Outcome
The results show funnels, success and drop-off rates, paths and heatmaps per screen, and export as CSV and JSON. The platform runs with Docker Compose, PostgreSQL and S3-compatible storage. Locally it also runs without Docker.
Planned, as of November 2026
Next up: prototypes from FigCraft
So far Labtrail only plays prototypes from Figma. That makes Figma the platform’s only external connection.
FigCraft by ArtCraft is an open-source design tool with prototyping. With the FigCraft server it can be run on your own servers. Both are still in alpha.
My plan: extend Labtrail so that studies can also contain prototypes from FigCraft in future. Participants would then see the prototype without any outside provider, and all data would stay entirely on your own servers. So far I know of no testing tool that supports FigCraft prototypes.
Two things are still missing in FigCraft for this: prototypes can’t be shared via link yet, and clicks and screen changes aren’t reported to other applications yet. I’m following the development of the server and, as soon as it’s possible, will start with a small spike, just like with Figma. In Labtrail, FigCraft will then become a second prototype source next to Figma, with the same analysis.
Limits and what I would do next
- No real study on this page yet: The results shown are simulated. A real study with participants, compared against an established tool, would say more.
- Figma as the only prototype source: Prototype tests require a Figma prototype. FigCraft is planned, other tools are not connected.
- More methods to come: Card sorting and tree testing are next, followed by preference and A/B tests and session recordings.
- Proven at small scale: Login rate limiting and the deletion job run per server process. For operation with many teams this would have to run centrally, and the public endpoints of the participant app need their own rate limiting.
What I take away
You design a testing tool mainly through its numbers. Which answers count, who decides on success and how honestly a drop-off is reported shape a team’s design decisions more than any interface. And whoever builds the platform also decides where the participants’ data lives.
Next project